
Dianna J. Spence – University of North Georgia

Student-directed projects have been a staple of my introductory statistics course for several years, as I want students to learn statistical inquiry through authentic experience. By “student-directed” I mean that the student (or team of 2-3) crafts a research question, defines appropriate variables, collects data, and identifies and uses the correct statistical analysis to address their question. I don’t give the students a list of topics to choose from; I want them to come up with topics based on their interests, and to come up with all of the supporting details.[pullquote]Here’s how I have organized the course to use both SBI and projects, and how I modified the projects themselves to leverage the benefits that SBI brought to the course.[/pullquote] There can be many decisions “packed into” a pre-defined research question—decisions about populations, variables, and how they are measured, and so on. I want students to “own” these decisions, because they are all part of the design of a statistical study. Instead of asking students to choose a question to match a designated analysis (as I did in earlier years), I now ask them to select a research question and then determine which analysis is best suited to answer it, adding authenticity to their research experience. After their proposed research is refined and approved, students carry out the study and report their process, results, and conclusions in a formal paper and in-class presentation.
Everything I have described was part of my statistics course long before I considered adopting simulation-based inference (SBI). Then I decided to use SBI in my course, which entailed overhauling the organization and focus of the course. The change was worth the effort: The proverbial light bulbs over my students’ heads appeared more frequently and shone brighter! Yet I still wanted to incorporate these projects into the course, retaining their benefits while also reaping those of SBI. Pondering how to fit the projects into the SBI curriculum, I realized that infusing SBI into the projects was equally important. Here’s how I have organized the course to use both SBI and projects, and how I modified the projects themselves to leverage the benefits that SBI brought to the course.
I ask students very early in the course to begin brainstorming a question they could research by collecting data. Then, as we explore various simulation examples with real data sets, I remind students to think more about their question: What kinds of questions could they address using a similarly organized data set? The process is iterative as we examine each type of scenario (one proportion, two proportions, linear regression, etc.) As we explore examples of each scenario, I point out that this type of analysis is another way they might be able to address the research question of their choice. After the first couple of scenarios, when students get familiar with the common theme underlying all tests of significance, I weave in discussions about collecting data and sampling, providing yet another platform for getting students started planning their own data collection. We talk through several options for obtaining data, from surveys to internet databases to actively measuring and recording physical phenomena.
During this phase, I don’t introduce any statistical tests based on theoretical distributions; we only discuss inference and statistical significance based on randomized simulations. As soon as students have seen all the scenarios (just over halfway through the course) the concrete work of the project begins.
Students develop a proposal detailing their research question, variables, data collection plan, 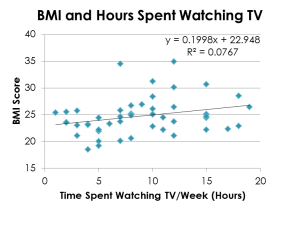 and the type of analysis they envision, which they describe using only the vocabulary that was introduced with the simulations (comparing two means, multiple proportions, etc.) Most proposals go through one or more cycles of review, feedback, and revision before being approved; then students are allowed to collect data. Their first deliverable is a summary of their data set, with descriptive statistics, plots, etc.; this engages students with their data while also serving to review material covered early in the course.
Only when projects are underway and we have explored all the scenarios, do I introduce the notion that theoretical distributions were accepted to answer these same inferential questions when simulations were not easily accomplished. I also discuss the downside to such models, particularly the faulty results that ensue when certain assumptions are not met. (Though I am not at liberty to omit these distributions from the course, I de-emphasize them by providing a “cookbook style” summary page and by not getting bogged down in many details.) I revisit each type of simulation analysis previously explored and demonstrate the corresponding theoretical test using software, briefly noting required assumptions, and emphasizing that these were a non-issue when using simulations. For at least one type of analysis, we compare the results of theoretical and simulation-based tests, both for a “well-behaved” data set and for one that doesn’t meet the assumptions of the theoretical model. This drives home the limitations of theoretical tests, while also setting the stage for similar comparisons they will make in their projects.
After revisiting each type of analysis, students conduct data analysis and write their report.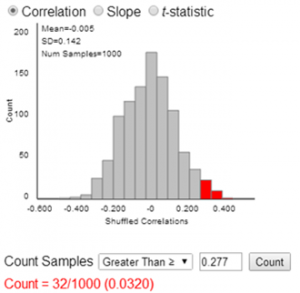 They conduct a significance test using the appropriate simulation applet; their report should contain screen shots and explanations of the process, and must explicitly state and interpret the p-value obtained. They follow this analysis with another significance test based on the appropriate theoretical distribution, including a discussion of whether the assumptions for that test were met. They must then compare the two results and explain similarities or differences. If the results are substantially different, they must discuss which results they are more inclined to trust, and why.
What impressed me the most after restructuring the course and the projects was the enhanced clarity (and correctness!) of students’ explanations of their project results. In prior classes, some student would inevitably misinterpret their p-value. For projects carried out in the context of SBI, I have not seen this mistake, and the students’ richer explanations reflect their fuller ownership of the process and logic of inference. [pullquote]the students’ richer explanations reflect their fuller ownership of the process and logic of inference. [/pullquote]Without question, SBI and student projects each add value to the course, and SBI adds value to the projects themselves.