
Frequently asked questions about simulation-based inference

Introduction: Over the past few years, I have had the privilege to participate in numerous conference presentations, panel discussions, email exchanges and workshops related to teaching simulation-based inference (SBI) in introductory statistics. During this time I have heard a variety of questions from other introductory statistics instructors about the use and teaching of SBI. What follows are the most common questions from those sessions as well as a series of specific (verbatim) questions from a recent online workshop (eCOTS 2014, freely available here), with brief summary responses to each.
Some caveats are worth mentioning:
- In most cases answers reflect the Introduction to Statistical Investigations (ISI) curriculum’s approach, and should not be considered reflective of all SBI curricula.
- Many responses could potentially fill many pages. The goal here was short summative responses. Some questions may appear in the future as blog topics with multiple individuals providing longer responses. Even now some answers provide links out to additional reading on the SBI blog or elsewhere.
- The responses below focus on Stat 101 (AP Statistics equivalent course), though some specific questions below address other courses. There is a specific section addressing K-12 topics.
- Before reading more you should read a great introduction to simulation-based inference in Allan Rossman’s introductory post for this blog to ensure a general familiarity with the terms used in what follows.
Feel free to ask follow-up questions by posting here in the comments section or joining and posting to the listserv.
Happy reading!
Nathan Tintle, Dordt College
- Why use simulation-based inference instead of traditional curriculum?
- Content in simulation-based inference courses
- Who is simulation-based inference appropriate for?
- How do I effectively teach this in my setting?
- Technology/software
- How do I convince others?
- K-12 specific questions
[i] WHY USE SIMULATION-BASED INFERENCE INSTEAD OF A TRADITIONAL CURRICULUM?
- Question: What is the advantage of this method over the traditional approach? Do students really learn better in a course focused this way?
- Answer: In short, we argue that simulation-based inference is more intuitive and approachable for students with little to no statistical training. Thus, without spending much of the course assembling the scaffolding of probability, in order to be able to discuss statistical inference late in the course, simulation-based inference is something that can be talked about in a meaningful way with students as early as the first day of class; (you can read several posts by SBI users on what they do on the first day of class here). This means that (a) more time can be spent on the overarching logic of statistical inference instead of rushing at the end of the term and (b) the simulations make the logic of inference more transparent for students rather than having them get lost in the ‘weeds’ of technical details, allowing for deeper understanding and more meaningful discussions about the entire statistical process. Preliminary assessment data published by our group suggests that students are really learning key concepts related to logic and scope of inference better using this approach. For more, we suggest you read the preface to the ISI curriculum and view an up-to-date list of presentations and papers we’ve published related to the curriculum and its performance, all of which are linked off of our main curriculum page (http://math.hope.edu/isi).
- Follow-up question: Tell me more. Will randomization-simulation really encourage conceptual understanding?
- Answer: In a traditional introductory statistics course substantial time is spent time on probability theory, sampling distribution theory, and the mathematical and probabilistic foundations of statistical inference. We find that this abstract approach to laying a foundation for inference does not maximize students’ ability to see the overarching logic of statistical inference. We argue that simulation-based methods are more intuitive for students, are more concrete, allow students to see a similar logical approach to inference regardless of data context, and can be introduced to students very early in the course—all of which encourage conceptual understanding. In the ISI curriculum, we also cover the typical descriptive statistics concepts, traditional methods of tests of significance and confidence intervals, all through a lens that emphasizes the overarching 6-step statistical method. We hope that introducing these more standard topics “as they are needed” will help students focus on the overall investigative process.
- Follow-up question: Tell me more. What is the evidence that these methods actually improve understanding of various concepts?
- Answer: We believe that there is evidence suggesting better conceptual understanding and retention of the key student learning outcomes related to the logic and scope of inference, with little reduction in learning gains elsewhere. Student attitudes towards the new curriculum are also good. We have published these results in a handful of papers listed below. We are currently involved in a broader research project which will lead to additional research papers. For more an up to date list of presentations and papers we’ve published related to the curriculum and its performance see our main curriculum page (http://math.hope.edu/isi).
- Tintle NL, VanderStoep J, Holmes V-L, Quisenberry B*, Swanson T. “Development and assessment of a preliminary randomization-based introductory statistics curriculum.” Journal of Statistics Education. Volume 19(1). March 2011. http://www.amstat.org/publications/jse/v19n1/tintle.pdf
- Tintle NL, Topliff K*, VanderStoep J, Holmes V-L, Swanson T “Retention of statistical concepts in a preliminary randomization based introductory statistics curriculum” Statistics Education Research Journal. May 2012. Volume 11(1). http://www.stat.auckland.ac.nz/~iase/serj/SERJ11(1)_Tintle.pdf
- Tintle NL, Rogers A*, Chance B, Cobb G, Rossman A, Roy S, Swanson T, VanderStoep J (2014). “Quantitative evidence for the use of simulation and randomization in the introductory statistics course” Proceedings of the ninth International Conference on Teaching Statistics. Flagstaff, Arizona. http://iase-web.org/icots/9/proceedings/pdfs/ICOTS9_8A3_TINTLE.pdf
- Swanson T, VanderStoep J, Tintle NL (2014) “Student attitudes toward statistics from a randomization-based curriculum” Proceedings of the ninth International Conference on Teaching Statistics. Flagstaff, Arizona. http://iase-web.org/icots/9/proceedings/pdfs/ICOTS9_1F1_SWANSON.pdf
- Roy S, Rossman A, Chance B, Cobb G, VanderStoep J, Tintle NL and Swanson T. (2014) “Using simulation/randomization to introduce p-value in week 1.” Proceedings of the ninth International Conference on Teaching Statistics. Flagstaff, Arizona. http://iase-web.org/icots/9/proceedings/pdfs/ICOTS9_4A2_ROY.pdf
- Chance B, and McGaughy K (2014) “Impact of a simulation/randomization-based curriculum on student understanding of p-values and confidence intervals.” Proceedings of the ninth International Conference on Teaching Statistics. Flagstaff, Arizona. http://icots.info/9/proceedings/pdfs/ICOTS9_6B1_CHANCE.pdf
- Question: Are there examples of how randomization-simulation methods are used outside of a teaching context?
- Answer: Although not a primary motivator of our approach, there is no question that simulation, bootstrapping, and permutation tests are all rapidly becoming part of the mainstream applied statistician’s toolbox. Some good introductory reading from a technical and applied perspective with an eye towards practice can be found in here. They are also growing in frequency in practice.
To read a series of posts on “Why SBI” go here.
[ii]CONTENT IN SIMULATION-BASED COURSES
- Question: What topics need to be removed from the curriculum to have the time to cover simulation-based inference? How do you find time to present both the randomization-based methods and the more “traditional” methods (z, t, etc.) that clients still expect our students to know about?
- Answer: Not much needs to be removed! Simulation-based inference methods act as an alternative way to help students understand inferential statistics (confidence intervals and tests of significance) instead of formal probability and sampling distribution theory. Probability and sampling distribution theory is covered less rigorously and abstractly, and more intuitively and by staying ‘close to the data’ in a simulation-based inference course. In the end, when talking to client departments about the key outcomes they wanted their students to know coming out of the course, nothing is different.
- Follow-up question: So you’re still doing the t? The F? Chi-square?
- Answer: Yes! We build a strong foundation for students by emphasizing the logic of statistical inference using simulation-based methods. Then t, F, chi-square and other ‘theory-based’ tests are merely convenient mathematical predictions of what would have happened if you had simulated. One topic we no longer cover is how to read tables of probability distributions.
- Question: How does the randomization approach compare to the standard parametric intro stat?
- Answer: It depends a lot on the curriculum. A few general themes are: (1) Most of us have the same main, end-of-semester learning goals that we had before (big picture understanding of data description and inference), (2) Most of us are still teaching the theory-based inference methods we were before (e.g., F, t, chi-square) and (3) Most of us are building student intuition and understanding of sample-to-sample variability through a mix of simulation, bootstrapping, and permutation tests instead of on formal probability and sampling theory.
- Question: How do you talk about the differences / similarities between the randomization distribution and the sampling distribution for the usual statistics methods? I’m interested in this issue both for beginning intro students who won’t have even seen sampling distributions yet and also for students who are more math/stat sophisticated and have seen and somewhat understood sampling distributions.
- Answer: It depends on the statistic being considered. For example, for a binomial distribution it is straightforward. If students have started by simulating outcomes from a binomial distribution (even if you haven’t named it as such), then they quickly see that in many cases you have resulting distributions that are somewhat bell-shaped. Thus, students are readily able to see that the normal approximation is a good approximation of the binomial when certain conditions are true. If you teach the exact binomial test (an option for more sophisticated students) you can discuss that the simulation is a finite set of samples from the exact test.
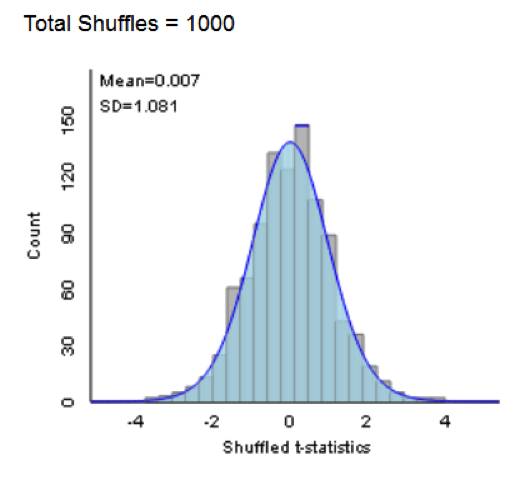
- For a two-sample means comparison we use the difference in group means as the statistic for a permutation test, and then state that the distribution of that statistic cannot be predicted directly very well use mathematical formulas, but that a t-statistic (a standardized version of the same test statistic) has a well-characterized mathematical distribution. Students can then see how a t-distribution is an excellent prediction of what was obtained via simulation (see figure below for an example from the ISI applets which visually show how the simulations and mathematical prediction agree in this case). If students already have a strong foundation in traditional sampling distribution theory, you might emphasize that the simulation approach will (a) give a good approximation of the p-value/distribution when certain conditions are met (e.g., sample size; quantitative variable distribution) and (b) is still valid when those conditions are not met, though, notably some conditions are needed for both (e.g., study design) and there may be some subtle additional conditions with the simulation test (e.g., more specific null hypothesis).
- Question: What topics do you teach before you teach simulation-based inference? Usually the Statistics course starts with probability. In your didactic sequence, what elements in probability do you consider basic to teach and what not?
- Answer: Our approach to probability is focused on simulation and building student intuition, instead of a more formal approach to probability theory (e.g., sets, combinations, density functions, etc.). For example, in the ISI curriculum we start the course by helping students gain an appreciation for the use of simulation to estimate long-run relative frequencies (e.g., probabilities) when the context is challenging (e.g., the Monty Hall problem). Students then transition to simulation of binomial situations using coins and spinners (and related applets) to do one-proportion tests of significance. A key element of the approach is that key learning objectives related to sampling distributions, probability, and inference are spiraled over throughout the curriculum. We don’t expect students to have as deep a grasp about probability after week one as a student in a traditional curriculum who spends multiple weeks on probability theory. However, as the course progresses we expect students to get a better and better understanding of the core logic of statistical inference, sampling distributions, and statistical thinking, ultimately surpassing the abilities of students in a traditional course.
Not much else is needed before jumping in. That said, we do briefly expose students to the idea of the overarching statistical process (6-steps) and distributional thinking (shape, center and variability) before moving to simulation-based inference. Embedded within our presentation of simulation-based inference is introduction of additional descriptive statistics topics and an emphasis on the 6-step process throughout.
- Question: I’d be interested in hearing the specific hands-on activities you use to get students involved, which software you use, and how to best illustrate concepts and how to test student knowledge.
- Answer: One of the great things about simulation-based inference is that it is so conducive to the use of hands-on activities. Our strategy is to start students with tactile simulations (pennies, spinners, cards) and then transition to web-applets that mirror what students have done (e.g., showing pictures of pennies, spinners, cards), but allow for higher numbers of repetitions. We argue that this is the best way to keep students from thinking that the applets/software is a black box. You might want to read our series on the use of technology in teaching simulation-based inference for more. You can get sample activities from different curricula by following the links on the Resources page. These pages often also include access to sample assessments.
- Question: How much material can you typically cover in a single semester with students who have no statistics background and are not confident in their math skills.
- Answer: There are simulation-based inference curricula (e.g., ISI, Lock5) which get through the ‘usual’ set of material for an introductory statistics course (up through, or completing ANOVA, regression, chi-square), but other curricula/courses end with two-sample comparisons. Even the Lock5 and ISI materials can be used in that way if one wishes. There seems to be a great deal of variety between individual instructors and institutions with regards to how far they get. So, far we haven’t seen many instructors radically change (increase/decrease) the amount of content they cover as a result of shifting to a simulation-based inference curriculum.
- Question: What key concept is the most misunderstood by your students, and how do you ‘fix’ it?
- Answer: This is a tough question because of the continuing progress all simulation-based inference curricula are making to address student learning ‘gaps’ potentially created using simulation-based inference. However, one area that you do need to be aware of when focusing on simulation-based methods is the distinction between sample size and number of (simulated) samples; as well as the distinction between the actual study results vs. the simulated studies. Some students at first may misunderstand the simulation as a way to “repeat the study” many times vs. repeating a simulated version of the study under a particular null hypothesis.
- We are trying to better understand why student performance on inference (testing and confidence intervals) assessment questions is better. As additional gaps in student learning appear, we will try to address them. I should also say that even though we haven’t seen much widespread performance issues (in fact, much is better!), we have noticed substantial instructor-to-instructor variability when it comes to particular gaps. Instructors using this approach should definitely pay attention to standardized assessments which can help identify areas of particular weakness for their students. Consider signing up to participate in our ongoing assessment project to get pre- and post-test student reports, and comparative data, while also helping us better understand overall student performance in simulation-based and non-simulation–based courses (sign up information is provided here).
- Question: How does the order of topics progress — in particular, does use of simulation allow you to introduce inference sooner and build on those concepts throughout the semester?
- Answer: Again this varies greatly between different simulation-based inference curricula. In general, though, all these curricula tend to get to inference sooner. In the ISI curriculum the first four chapters focus on what we consider to be the four ‘pillars of inference’: Significance, Estimation, Generalization, and Causation. After introducing these four ‘big’ concepts and the repeated question of “could this sample result have occurred by chance alone,” later chapters focus on different types of two-variable inference problems (e.g., two proportions, two means, multiple proportions, correlation/regression, etc.), but again following the same six-step investigation process and revisiting the four pillars in each new data scenario.
- Question: How do you motivate CI’s (as opposed to p-values) from permutation tests / simulation?
- Answer: Approaches vary widely across different simulation-based inference curricula. In the ISI curriculum we teach tests of significance about a single proportion first. We then have students conduct tests with different null hypothesis values determining which null values are ‘plausible’ based on the observed data and which aren’t: generating an interval of plausible values, the confidence interval. We then quickly transition students to a shortcut approach using two times the standard error of the simulated sampling distribution which gives a conservatively estimated 95% confidence interval. Our approach, as opposed to bootstrapping, and arguments from a number of individuals on the pros and cons of these are approaches are included in a series of posts here. One issue worth thinking about is how you want to define the parameter in a permutation test.
- Question: Would I be right that in your course you do descriptive statistics in a “just-in-time” way? At what point, if at all, do you have a section on EDA?
- Answer: Again, simulation-based inference curricula differ on this issue. In the ISI curriculum we take an approach advocated by Malone et al. and Chance/Rossman , which organizes the course around types of data instead of disconnecting EDA and inference. You could view this as covering descriptive statistics/EDA ‘just in time’ to answer the research question(s) being covered in that section (e.g., comparative boxplots don’t come up until we evaluate multiple groups of quantitative data). We feel that this approach gives a clearer picture to students about the role of statistical thinking in the research process. Thus, by end of the course students will have seen all of the usual EDA methods, but always along with the corresponding inferential methods, emphasizing how different EDA methods help in exploring different kinds of research questions.
- Question: I feel like I have difficulties transitioning between randomization-based methods and the more “traditional” methods. When I teach both (as I do now using the Lock et al. text), students wonder why we have to cover both and when they would use one approach versus the other. Since the randomization-based methods are new for me and not how I learned statistics, it’s not always easy for me to give good arguments about why students might choose a randomization-based method versus something in the consensus curriculum. Do you have thoughts about that, or suggestions?
- Answer: There are different ways of approaching this, but here is my favorite. We start with simulation-based approaches. Once these are reasonably well understood by students I ask them why these methods would have been impossible 100 years ago. They realize that computing power is needed and so the methods weren’t possible as we are using them. I then tell them that people who knew a lot of mathematics were able to predict what would happen if you were to simulate—pointing out that often the distributions they simulated have similar shape (e.g., bell-curve) and a predictable center. We then overlay these ‘theory-based’ distributions on the simulated distributions showing that, in many cases, they are good fits and so both approaches will give similar results. We also make sure to show students cases where they are not good fits, and tie these discussions directly to discussions about extra validity conditions (e.g., sample size requirements) for theory-based approaches to accurately predict the shape of the distribution. In justifying why we still look at the traditional methods, we mostly appeal to tradition – it’s why they will still see in many journal articles. Some of us also talk about the added convenience of finding confidence intervals using traditional approaches when we are not using bootstrapping. For a series of posts on “why teach normal-based methods” go here.
- Question: In Lock5 and their StatKey software, the term ‘randomization test’ is used for all permutation testing, even for observational studies. Are you following their lead, or is it not too late to protest that ‘permutation testing’ is the broader term and should be preferred?
- Answer: In this blog we have adopted the term simulation-based inference as a more general, overarching term to cover multiple kinds of analysis strategies. For example, we say “A simulation-based approach to comparing two proportions.” But in the ISI curriculum, we do tend to use “shuffling” when we have two variables for both experiments and observational studies. We start with experimental studies where the shuffling makes more intuitive sense and then tell students that this is a reasonable approach with observational studies as well. We do tend to use “randomization” rather than “permutation” especially when we are conducting a simulation rather than all possible random assignments.
- Question: Why aren’t you doing the bootstrap? How is this a randomization curriculum without the bootstrap?
- Answer: For the ISI curriculum, this point is elaborated on in a blog post here. For comments from others about the bootstrap read the entire series of posts.
- Question: Do you allow student gathered data?
- Answer: We not only allow student gathered data but, in line with ‘best practices’ in statistics education, encourage it! In particular, there are numerous places in the curriculum where in-class explorations involved student gathered data to encourage active participation and engagement with students. Beyond this, and importantly, however is our belief that students should do data analysis projects, preferably with students involved in the study design, as part of an introductory statistics course; you can read a series of posts about student projects here. We have sample materials we would be happy to share upon request. Notably, one advantage of our approach is that by discussing inference earlier in the course we believe that students are able to design more substantive projects.
- Question: Where do you cover data collection or is it integrated throughout?
- Answer: By introducing the 6-step statistical investigation process early in the course we are able to begin to talk about design issues as early as the very first section of the book. We explicitly introduce design/data collection in chapters 2 (random sampling) and chapter 4 (random assignment) as two of the four ‘pillars of inference.’ With this foundation, Chapters 5-10 expect students to apply their understanding of the impact of study design questions on the scope of conclusions to nearly every study students investigate.
- Question: What is the interpretation of the confidence level with the bootstrap? For example, traditionally, we are using a method which if repeated many times 95% of the intervals would capture the true parameter. Also, how do you convince students that the bootstrap distribution is a good approximation to the true sampling distribution?
- Answer: In the ISI curriculum we have opted not to do the bootstrap, as elaborated on in a blog post here. For comments from others about the bootstrap read the entire series of posts.
- Question: When relying on the bootstrap, it seems that the key assumption is that your original sample is a SRS that is representative of your population. What if you get an unusual sample though?
- Answer: Great point. Of course, that’s a problem with traditional methods as well. Both the bootstrap and theory-based methods are impacted substantially by poor or unlucky data collection. It’s important to emphasize that samples should be representative of the population in order to generalize to a population regardless of the analytic method you choose to use. That said, in the ISI curriculum we have opted not to do the bootstrap, as elaborated on in a blog post here. For comments from others about the bootstrap read the entire series of posts.
[iii]WHO IS SIMULATION-BASED INFERENCE APPROPRIATE FOR? WHERE DOES THIS FIT IN THE CURRICULUM?
- Question: Is this approach appropriate beyond the first/introductory course? Do you envision randomization based courses to be the first intro course or could it possibly be that this is a second course? How do you envision randomization-based approaches to teaching fitting in, for example, a minor in statistics or major in statistics?
- Answer: This is a great, complicated question. Although our initial vision was primarily for the first course, the jury is still out about impact beyond the first course! We believe there may be some value in exploring aspects of this approach in second courses and beyond. For example, using it to emphasize the big picture and logic of statistical inference or using it to illustrate how to design and analyze alternative study design (e.g., blocking). With regards to stat and math majors and minors, we believe the answer is ‘yes.’ Too often it seems that these groups are seeing more of the mathematics of statistics, instead of courses which emphasize statistical thinking. Arguably, statistical thinking is better encouraged by courses using simulation-based inference. See, for example ISCAM and Mathematical Statistics with Resampling and R. Also, we have a few posts about the implications of simulation-based methods of inference for undergraduate curricula on the blog.
We also note that it remains to be seen what the impact of the Common Core State Standards will be. If basic simulation and randomization test ideas are indeed discussed in high school, that could change the role of the introductory college course as well.
For additional discussion see:
Tintle NL, Chance B, Cobb G, Rossman A, Roy S, Swanson T and VanderStoep J. (2013) “Challenging the state of the art in post-introductory statistics: Preparation, concepts and pedagogy.” Proceedings of the world congress on statistics. http://2013.isiproceedings.org/Files/IPS032-P1-S.pdf
Tintle NL, Chance B, Cobb G, Roy S, Swanson T and VanderStoep J. “Combating anti-statistical thinking through the use of simulation-based methods throughout the undergraduate curriculum”. White paper. In revision at The American Statistician. May 2015. http://math.hope.edu/isi/presentations/white_paper_sim_inf_thru_curriculum.pdf
- Question: Have you used this approach with business students? If so what adjustments have you done? In business very often one has to use data collected by somebody else. I mean “data is given.”
- Answer: We believe that this approach works for most, if not all, audiences of introductory students. In the ISI curriculum we have interwoven a variety of different disciplinary examples throughout the course, including business examples. We believe the ISI curriculum can be used in both general (mixed disciplinary audience) and with discipline specific audiences. With regards to the aspect of this question referencing use of data collected by someone else, this is reflected in our curriculum in most places by our emphasis on utilizing published research data for our examples. Increasingly, these methods (simulation, bootstrapping, permutation tests) are being used in applied statistical practice.
- Question: I only teach a small unit on hypothesis testing for this class because it’s more of a reading/writing class than a data analysis class. Is it possible to use randomization-simulation activities even at this low level?
- Answer: We believe that this is a great place to start. For example, the use of simulation for tests on a single proportion is something that can be discussed with students of almost any level as early as the first day or two of a course. Very little foundation beyond basic algebra is needed. We are not alone in this thinking. The Common Core State Standards suggest basic introduction to informal statistical inference via simulation-based methods in middle and high-school.
- Question: This method is good to demo p-value, but not power of the test?
- Answer: We use simulation to introduce the idea of power as well. See, for example, an applet demonstrating this here: http://www.rossmanchance.com/ISIapplets.html and click on “Power simulation.” This applet allows students to simulate power for a test of a single proportion. Activities using this applet to explore power are in the ISI curriculum.
- Question: How do you think a course like this does as a “stand alone” – for example for students who only ever take 1 or maybe 2 semesters of stats ever for their degrees
- Answer: We believe that the approach does excellent in this setting. Most of the students utilizing the ISI curriculum will not take another statistics course, though some do take second courses, research methods courses and/or other course work in related fields. We believe after this course, students are well-prepared both for reading the newspaper and for reading journal articles in their field. In fact, we like to emphasize that a p-value is a p-value regardless of how complicated the method is to get there and students should be able to carry over this “strength of evidence” approach to other courses as well.
- Question: How do you address assumptions of traditional and simulation-based methods when using this approach?
- Answer: Our approach reflects the idea that all methods, traditional and simulation-based, have conditions and assumptions that must be true for the methods to be valid. However, it’s easy for students to get stuck on memorizing and focusing on black and white rules that are, at best, arbitrary. With this in mind here are some guiding principles that we’ve tried to incorporate in the ISI curriculum:
- Traditional (asymptotic) methods can often be thought of as theoretical predictions of what would happen if you simulated an infinite number of times (or for all possible samples / random assignments). However, these predictions are only true when certain data conditions are met
- Both permutation tests and asymptotic tests testing for differences across groups require independent groups (no pairing/repeated measures)
- Many assumptions and conditions end up being very nuanced and students quickly shift to memorizing instead of seeing the big picture. With this in mind, we have tried to focus on a few overarching data validity conditions for traditional tests: bigger sample size is better, underlying data normality is better for quantitative variables, and equal variance among groups or around regression lines are better.
- One way to evaluate whether or not validity conditions are impacting downstream inferential conclusions from traditional methods is to do the corresponding tests of significance using simulation-based methods and seeing if similar conclusions are reached
[iv]HOW DO I EFFECTIVELY TEACH THIS IN MY SETTING?
- Question: How do these work in a large class? How would you use technology/software in this large class/lecture hall setting? What if the teacher is the only one with a computer?
- Answer: There are numerous ways to make simulation-based inference methods work in a large lecture hall setting, or a classroom setting where only the instructor has a computer. Although it might be more ideal to have students at the computer, even for one day a week, we believe a demonstration at the front of the room still outweighs a more passive lecture. We also believe the technology tools are straight-forward enough that students can follow-up largely on their own at home.
- Question: How can you incorporate these activities in a 50-minute class? Do we need long class periods to accommodate activities?
- Answer: A number of instructors using the ISI materials use them in 50-minute class periods. Our instructors’ guide provides an activity-by-activity discussion of classroom implementation including discussion of adaptation for different length class periods. We don’t believe you have to have longer class periods to accommodate an active learning approach to teaching these concepts. Our instructors’ guide is available by linking off of the “Instructor Resources” page at http://math.hope.edu/isi
- Question: Do you know of anyone who has used a flipped-classroom approach with randomization-based methods? If so, how did it go?
- Answer: A couple of us (Tintle, Chance) have used these approaches in a flipped-classroom, online hybrid, or completely online setting. In short, we have found the transition to be reasonably straightforward, with no ‘fundamental’ issues precluding the use of simulation-based approaches in these settings. For the ISI curriculum, we have developed a series of over 200 learning objective based videos which students can view outside of class and/or use to supplement the reading. Two of the ISI authors (Chance and Roy) have utilized stand-alone lab activities that students can largely complete on their own, leading to a written report for evaluation. Although appropriate care and concern needs to be taken with regards to creating an active-learning environment in these spaces, the guided discovery activities for the ISI curriculum embrace an active learning pedagogy and so having students do these activities should ensure maximal impact of these approaches.
- Question: How would you suggest handling the in-class hands-on simulations in an online environment where students are not in the same physical space?
- Answer: We suggest at least three ways:
- We have a series of videos that help introduce these concepts. We also believe there may be value having individual instructors develop their own personalized videos for their classes—this could involve having students watch the instructor actually do the simulation.
- Our (ISI) activities encourage students to actually do the hands-on simulations regardless of whether or not a student is physically in class.
- Encourage students to connect with other students in small group (in person, or online) to do these tactile simulations together and share results.
Finally, our activities also purposely scaffold students from doing their own by-hand simulations to using the computer to do many simulations using pictures of coins, spinners or cards to emphasize the connections—thus, tactile simulations are being reinforced, even when using the computer.
- Question: What are the best ways to use randomization activities to augment a traditional curriculum?
- Answer: We are hoping in the future to be able to argue more clearly in terms of student learning gains about how simulation-based inference is ‘enough’ to recognize the key benefits of randomization activities. Many instructors are taking an ‘all in approach’ and using one of the simulation-based curricula, while many other instructors are still starting by taking one or two class periods to use simulation to augment a traditional approach to introducing inference. For example, by doing a simulation for a one-sample test either immediately before or after the traditional one-sample test and/or similar for the first two-sample test that is presented in class.
- Question: To what degree does your curriculum depend on group activities?
- Answer: Students are a diverse group, learning in many different ways. Our curriculum tries to reflect this by offering many different opportunities for students and instructors to learn the concepts. More specifically, to your question, I often allow students time in class for students to work in groups or individually on the guided discovery activities to hopefully let students find the format which works best for them. That said, I also make sure that over the course of the semester I am using a variety of different pedagogical approaches.
- Question: How do you deal with the applets on exams? Do the students work on laptops during exams? If so, do you worry about them communicating with each other during the exams?
- Answer: We see some variety in how instructors do assessment, especially with regards to the applets.
- Some instructors take applet screen captures and then ask students to interpret output and/or ‘fill in the boxes’—thus, requiring no active use of technology during exams.
- Some instructors have students take exams in computer labs with access controls that make it possible for students to use applets and nothing else (e.g., other webpages).
- Some instructors write exams which are such that internet access or other resources would not be an issue (e.g., more open-ended, mini-data analysis type).
- Question: In general, how do tests and exams differ from the traditional approach of teaching statistics?
- Answer: The previous response gives a partial answer. Additionally, we are focused much more on statistical concepts and not statistical techniques or computation. We would be happy to share sample assessments that demonstrate this. See the GAISE guidelines for additional discussion and some general examples.
- Question: Some of my students have had some exposure to statistics in, for example, an intro biology class. Unfortunately they come in with the ‘buzz words’ of statistics, without really any conceptual understanding of what they mean. So when I’ve tried to introduce randomization-based activities, these students tend to have a harder time understanding these as they just want to apply their “buzz word vocabulary.” How do you “reset” these students’ minds and/or handle these students?
- Answer: Many students enter a first course in Statistics with preconceived notions about statistics. These attitudes can often be grouped under a two major themes.
- Statistics = Mathematics (algorithmic; memorize)
- Statistics can be made to say whatever you want.
I try to address these concerns on day one of the course by emphasizing that statistics is not mathematics, and that our goal is to see how to use statistics as a tool to better understand how the world works, based on our observation of it (inductive reasoning).
In some ways our approach can be harder on these students because they expect the course to sequence in a specific way and can be impatient to get to the parts they are more familiar with, but it also gives you an opportunity to start from scratch a bit and develop terminology and scaffolding in a more logical way.
- Question: Do you include homework assignments to go along with the applets?
- Answer: In the ISI curriculum we take a two-pronged approach to this question. First, we have guided discovery activities (“Explorations” – you can request to see “Sample Materials” by going to the ISI page) for each section of the book. These activities can be done in-class or assigned as out of class homework. Additionally, we have a variety of types of homework questions including conceptual questions, low-level practice questions, applied questions (mini-data sets), investigations (more in-depth ‘capstone’ activities for each chapter) and research article (read an article and answer a series of questions) for all sections/chapters of the book. We find a great diversity in the way and amount instructors use these homework exercises in their classes.
- Question: Does the textbook *only* have traditional (paper-based) assignments, or are there any online homework options that would work with your book?
- Answer: Most of the major simulation-based curricula have online homework options. We are working with Wiley to develop such a system for the first edition of the ISI curriculum, with a targeted completion date of early 2016 if not before.
- Question: Can a course of this type coexist in an environment where there are many other sections taught in traditional parametric form?
- Answer: We believe the answer to this is yes, it can. In particular, the majority of ‘end of semester’ major learning goals can be the same across sections. For example, learning objectives related to familiarity with traditional/asymptotic tests and confidence intervals, grounding in the core logic of inference, descriptive statistics, impact of study design, etc., can be the same across sections.
- Question: Our students use the stats course for transfer credit to 4 year institutions and sometimes as a prerequisite for a second statistics course. Has there been any issue with acceptance of this curriculum between departments at your schools for these purposes
- Answer: We have worked hard at our institutions to make sure that the same major learning objectives are reached in our new version of the course as was the case before (see previous question/answer) and so this has not been a problem.
- Question: What are your suggestions for what software to use? What if software access is a challenge?
- Answer: In general, developers of simulation-based inference curricula use custom software for teaching and introducing randomization methods (e.g., free or inexpensive web applets), but many users of simulation-based curricula also use a standard ‘off the shelf’ stat package (e.g., Minitab, SPSS, JMP) to demonstrate traditional (theory-based; asymptotic) methods. The argument is two-fold: (1) Standard packages, typically, have not included simulation-based methods, at least not without special plug-ins, (2) The custom software also gives us the ability to design the software tools around student learning and worry less about utility for doing statistics in practice. Standard packages can then be used for students to supplement their analyses with an emphasis on doing statistics and interpreting typical output. Standard packages are, however, adding more capabilities in the areas of simulation, bootstrapping, and permutation tests and so may be more sufficient in the future. However, it remains to be seen how well these packages contribute to the overall initial learning process for these methods.
- Another option is to use software that consistently shows both approaches (simulation and theory) simultaneously, like the ISI applets. The ISI curriculum has a suite of web applets (available here: http://math.hope.edu/isi) that are freely available and written in Javascript, meaning they are available on all devices (including smartphones, iPads, etc.). Theory-based methods are integrated and so these applets are completely sufficient for teaching the course; however, some instructors choose to supplement the curriculum with other standard packages. We are in the process of developing supplemental materials for use with other packages in addition to the applets.
- Follow-up question: When I try to use applets in class, I often find that many of the students do not have the plugins needed to run them, and it turns into a fiasco. What plugins are needed for the applets?
- Answer: Most of us are transitioning (or have already!) all applets to JavaScript, which are available on all devices with a minimal amount of platform/software/local computer issues. Dramatically better than Java! That said, there will always be some minor issues but the number of issues has dropped dramatically of late with the switch to JavaScript.
- Another follow-up question: Using your free software significantly reduces the technology barrier, freeing students up to think about what is happening conceptually. On the other hand, the software is quite limiting for uses on real applications later. Is there a happy medium?
- Answer: Some of us think using both applets and a traditional package is the best, while others prefer to just stick with one software tool that can do both methods (simulation-based and theory-based). One approach is to start with free software exclusively and then expose students to real analysis software later in the course—especially as a tool for doing their own student projects. This should ease the transition to the traditional software, after students have a firmer understanding of the larger statistical ideas. Some applets specialized for SBI curricula (e.g., ISI applets) allow users to upload their own data and may also provide the option for traditional looking output.
- Question: How do we get in touch with folks who are using these course materials with R?
- Answer: We suggest you join the simulation-based inference listserv where you can connect with other folks interested in simulation-based inference who are using R. There are a growing number of individuals using R in the course, especially if accompanied by the visuals provided by applets.
- Question: What is the best and least expensive software for randomization-simulation? What are the options?
- Answer: As noted above, many of the software options for teaching SBI are free applets. R is also free if you are looking for a traditional package with which to supplement. See some previous questions above for more details.
- Question: Is it true that smartphones can use the applets?
- Answer: In general, any applets written in JavaScript will work on smartphones. See questions above for more details.
- Question: The applets that you have for the SBI curriculum at http://math.hope.edu/isi are fairly specialized to the individual problems they were modeling. If students do projects where they choose a topic, how hard is it for them to adapt these simulation methods to their highly-individualized projects?
- Answer: I’ve found that when given the choice between a stat package (e.g., R, SPSS, etc.) and applets, in an introductory “Stat 101” course where students have access to both, approximately 25-40% of students use the stat package, compared to 60-75% of students choosing to use the (ISI) applets in conjunction with, say, excel for basic data manipulation. I think this attests to the fact that students are comfortable using the applets, but many are also comfortable using a stand-alone package. The ISI applets allow students to enter their own data; of course, students need to be able to correctly choose the applet (e.g. one proportion vs. multiple proportions vs. multiple means) they should be using.
- Question: Do you find that the computing skills required to implement these randomization-based approaches can lead to confusion among students that is not related to the actual statistical-concepts being covered?
- Answer: For most of us, there is little (if any) implementation overhead for the free applets. The design of the applets has been developed simultaneous to classroom implementation (including the tactile simulation strategies) so that feedback from students and instructors on layout and utilization is reflected in their design—minimizing confusion among students using the applets. For a more on this see our answer to common student mistakes.
For a series of posts by SBI users on how they use technology go here.
- Question: How do you convince your client departments that this is a good way to go? What if they say that they need their students to learn hypothesis testing the same way their discipline uses it or else they won’t understand the professional literature?
- Answer: Many curricula using this approach, ISI included, utilize simulation-based methods as an alternative ‘bridge’ to traditional methods. We argue that this approach offers a stronger foundation, and gives up little to nothing in the way of student understanding of traditional approaches. It is our experience that most client departments are very receptive to us saying “We’re still going to teach the ________________ (test du jour of that discipline), but we’re going to build student understanding of that approach on a stronger foundation.”
- Question: How do you get your colleagues to consider offering a non-traditional approach to teaching stats?
- Answer: Some mathematical colleagues may be less excited to using and/or this approach as it is de-emphasizing the mathematical content for the statistical. Arguably, this comes from colleagues who are less familiar with the distinctions between statistical and mathematical thinking. In this case, emphasizing the necessity for students to grasp the difference between mathematical thinking and statistical thinking is important. We have found it helpful to let these arguments about the necessity come from the client departments as well as from statisticians. We lay out some of our rationale for the importance of statistical thinking vs. mathematical thinking, and the way simulation-based inference encourages this, more clearly in this article:
Tintle NL, Chance B, Cobb G, Roy S, Swanson T and VanderStoep J. “Combating anti-statistical thinking through the use of simulation-based methods throughout the undergraduate curriculum”. White paper. In revision at The American Statistician. May 2015. http://math.hope.edu/isi/presentations/white_paper_sim_inf_thru_curriculum.pdf
- Question: With over 500 students per semester taking our intro stats course, we have a great variety of instructors (both full- & part-time). Many are very hesitant to commit to randomization-based inference and bootstrap techniques. They are used to the traditional t-tests and formulaic approaches. Any ideas about how I can “sway” faculty to give these methods a try?
- Answer: A lot of this likely stems from a fear of the unknown. In an earlier answer above we talk about the building evidence of improved conceptual understanding, attitudes, and retention among these students. Additionally, anecdotally, we find most instructors very excited about this approach once they try, with few going back to the old way once they try simulation-based inference.
Other ideas are for you to invite these folks into your classroom for a day when you are doing a tactile simulation for them to experience what it’s like, in minimal-time/low-cost manner. We also would encourage you to get these folks reading and thinking about simulation-based inference by directing them to the blog, listserv, watching the archived 2-hour mini-workshop we presented last May (eCOTS 2014) or sending them to one of the many professional development workshops we offer (see http://math.hope.edu/isi for a link).
- Question: What professional development opportunities do you have?
- Answer: We are fortunate that our current NSF grant (DUE 1323210) is sponsoring a series of workshops for the next couple of years. Most workshops are free. See a list of upcoming workshops here. There are also a variety of online resources including our blog, listserv and a 2-hour online workshop presentation you can view here.
- Question: What advice do you have for professors teaching statistics in a specific subject area, especially when the subject area, not the statistics, is their expertise?
- Answer: The great thing about simulation-based inference is that the arguments about improved conceptual understanding and its intuitive ease, apply to new instructors as well. Anecdotally and arguably, we think simulation-based inference may be easier for new instructors of introductory statistics to pick-up and teach well than the traditional course—with regards to student outcomes in the area of statistical thinking.
- Question: Because randomization-based inference is in the Common Core State Standards, do you have recommendations for high school teachers and those providing professional development for them?
- Answer: There is certainly a dearth of materials using simulation-based inference methods directed at the K-12 level, even though they are in the core standards (go to the SBI blog’s resources page, and click on Josh Tabor’s book “Statistical Reasoning in Sports” to see one exception). That said, many instructors are adapting college level materials for use at the K-12 level, instructors are attending our workshops and are actively participating in discussions about these curricular innovations.
- Question: Do you have any outcomes data related to the implementation of this approach in AP statistics courses (particularly with respect to performance on the AP exam)?
- Answer: We have not published anything focusing on AP Statistics and/or HS implementations specifically yet, but, speaking in generalities, data that we have seen to this point suggests similar performance to the undergraduate level. If you join the SBI listserv you can connect with other HS teachers and have them share their experiences with you directly.
See posts by high school/AP statistics teachers on how they include simulation-based methods in high school statistics and AP Statistics classes.
Hello! Woulod yoou mind if I shar your blog with my zynga group?
There’s a lot of folks that I think would really enjoy your content.
Please leet me know. Many thanks
You may share the blog.
Rejection is informative when you have a strong reason to believe that the RNG hypothesis *really is true* like youre trying to detect when someone fudged their randomization protocol in a clinical study, or you have a large historical dataset that you’ve fit an RNG model to and you are concerned something in the world might have changed, like in a manufacturing process control scenario.
In those scenarios you either really did use an RNG or you specifically fit an RNG to match your historic data well… Rejecting these tells you something about how your current data differs from something you really expect.
In a scenario where you are testing a “default” un-tuned hypothesis, rejecting it isn’t too surprising, but not rejecting it tells you that your data isn’t particularly informative, it can’t be distinguished from a braindead model of how it arose.