
Tim Hesterberg – Google

Here are some arguments for why we should not use bootstrap methods and permutation tests in teaching Stat 101:
- Our usual cookbooks of formulas is such a resounding success, inspiring generations of students to further study (and rewarding their instructors with stellar reviews),
[pullquote]Bootstrapping and permutation tests make hard abstract concepts like sampling distributions, p-values, standard errors, and confidence intervals more concrete;[/pullquote]
- Students find concepts like sampling distributions, p-values, standard errors, and confidence intervals to be intuitive,
- Graphs that demonstrate these concepts would just confuse them,
- Students welcome the mental gymnastics involved in working with a pivotal statistic like
 , rather than working directly with
  .
. - Students do so well with formulas that they don’t need a way to check their work.
I’m being facetious, of course. Bootstrapping and permutation tests make hard abstract concepts like sampling distributions, p-values, standard errors, and confidence intervals more concrete; students can visualize them using histograms of bootstrap or permutation distributions. They can use tools they earlier applied to data – histograms, normal quantile plots, and numerical summaries -to these resampling distributions. They can work directly with the statistics of interest, like a mean, or difference of means.
These methods also let us do better statistics. We talk early in Stat 101 about the advantages of a median. But when it is time for confidence intervals and hypothesis tests, we try to ignore it, like a crazy uncle in a closet, because we don’t have easy formulas. With resampling we can use the statistics we want to, without developing new formulas for inferences for every statistic. So we can use the mean, or median, or heck, even a midmean (aka 25% trimmed mean, the mean of the middle 50% of the observations). We can use robust regression.
 Speaking of regression, bootstrapping regression lines gives a nice picture of how accurate predictions are, and how the more you extrapolate the less accurate the predictions are. Doing these lines superimposed over the original data also helps demonstrate another idea, the difference between a confidence interval and a prediction interval—students can see that the range of predictions from the regression lines (a confidence interval) captures only a small fraction of the observations.
The very process of resampling, bootstrapping in particular, reinforces statistical ideas. In bootstrapping we draw samples from a population to estimate how the statistic varies due to random sampling – this reinforces the central role that random sampling plays in obtaining data.
The methods are important in practice, too. I work at a little internet search company called Google. In an article “What Teachers Should Know about the Bootstrap: Resampling Within the Undergraduate Statistics Curriculum” that I recently placed on ArXiv, I give a number of examples where we use resampling, because it is the only practical way to get answers, or to avoid bias.
Check out that article; I talk about
- Pedagogical advantages of resampling,
- The idea behind the bootstrap,
- What you can and cannot do with it,
- Things to watch out for (like the sample standard deviation),
- Accuracy.
What do I mean by accuracy? You’re probably familiar with the old rule “if n > 30 and the sample is not too skewed,” then it is OK to rely on the CLT and use t-test and intervals. Tell me now – what does “not too skewed” mean? What if my sample is size 50, is it OK then? How accurate is it? What if the sample is skewed, then how big does n have to be? Can’t answer, huh? Not too useful a rule, is it?
In the article, I describe how to use either bootstrap methods, or some relatively easy formulas, to estimate how accurate the standard t methods are.
So take a guess – how large does n have to be, before t methods are reasonably accurate, if the population has the skewness of an exponential distribution? You’re too low, guess again.
Nope, still too low 🙂
You need n > 5000 before t methods are reasonably accurate (probabilities are within 10% of 0.025 on each side). [pullquote]The CLT operates on glacial time scales, when there is skewness.[/pullquote]
I also talk about which bootstrap methods are more accurate. Some things will surprise you. You may think about using the bootstrap in small samples, and t methods for larger samples. But that is backward, at least for the bootstrap percentile interval— it is horrible for small samples (it is too narrow), but better than t methods for large samples (n > 34, for an exponential population).
|
Figure 21 from Hesterberg(2014): The lines with codes are non-coverage probabilities on the right, where the interval is below the parameter. The lines without codes correspond to the left side. |
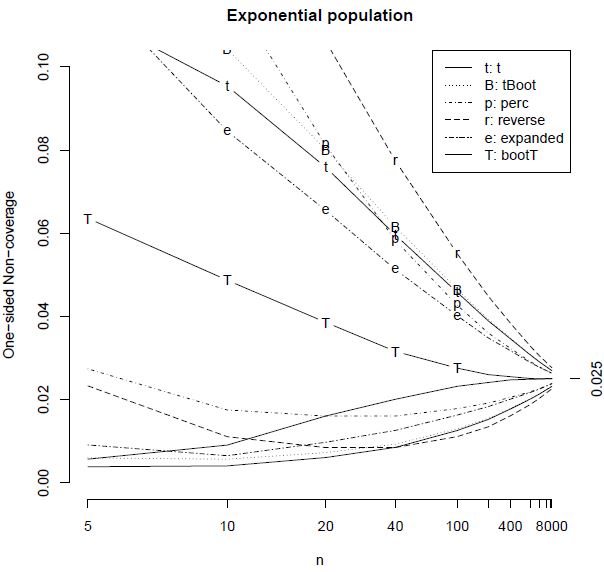
Another thing – when the sample is skewed, the bootstrap percentile interval is asymmetrical – but not asymmetrical enough by a factor of 3. For positively skewed data, a good interval needs to reach way to the right.
So check out the article – http://arxiv.org/abs/1411.5279 .
While I do not entirely agree with Tim’s paper, I do think it is probably the most important paper yet published on the topic in its title. There is LOTS to think about here. I hope everyone on this list will read it.
Pingback: How I teach SBI using R | Simulation-based statistical inference
Pingback: Why we aren’t bootstrapping yet | Simulation-based statistical inference