
 Catherine Case, University of Florida
My first experience teaching statistics was at the college level, so for my first few years of teaching, I never heard the infamous question, “Can we have a free day?” Now that I teach AP Statistics at a high school, I do hear that question from time-to-time (somewhere between 1 and 1 million times per day), and I need to be prepared with a good answer! Why should they care about what we’re doing in class today? My first goal for each class is to get buy-in from my students, to convince them that statistics is relevant to their lives and we have important, interesting things to accomplish. Simulation-based inference helps me do that. We’re able to draw inferences from real-world data starting on the first day of class, and breaking out spinners, dice, and coins never hurts! [pullquote]Incorporating simulation-based inference in a high school statistics class presents… opportunities for students to make connections and gain experience with statistical inference throughout the course.[/pullquote]
Simulation-based inference provides engaging learning experiences, but it also presents its own set of challenges. Over time, I’ve modified my approach in a few ways to make the most of these inference activities in a high school classroom.
- A little structure goes a long way.
Many of my high school students are friends outside of class, and while I’m grateful for the lively learning environment this creates, it means working groups may occasionally get off task. Providing a structure to organize the simulation encourages students to get started right away and work efficiently.
For example, a few weeks ago our class investigated whether people have a tendency to associate certain facial features with a name. (This study was mentioned in this blog post by Nathan Tintle, and a version of this activity/exploration can be found by going to the Introduction to Statistical Investigations link, and clicking on the Chapter 1 link.) We flipped coins to explore what proportion of people would match two faces with the correct names (Bob and Tim) if everyone was just guessing. Each pair of students was provided with a table to tally the number of heads and tails and to record summary statistics for each simulated sample; see Figure 1 for an example of student work. This made the unwieldy process of physical simulation more efficient.
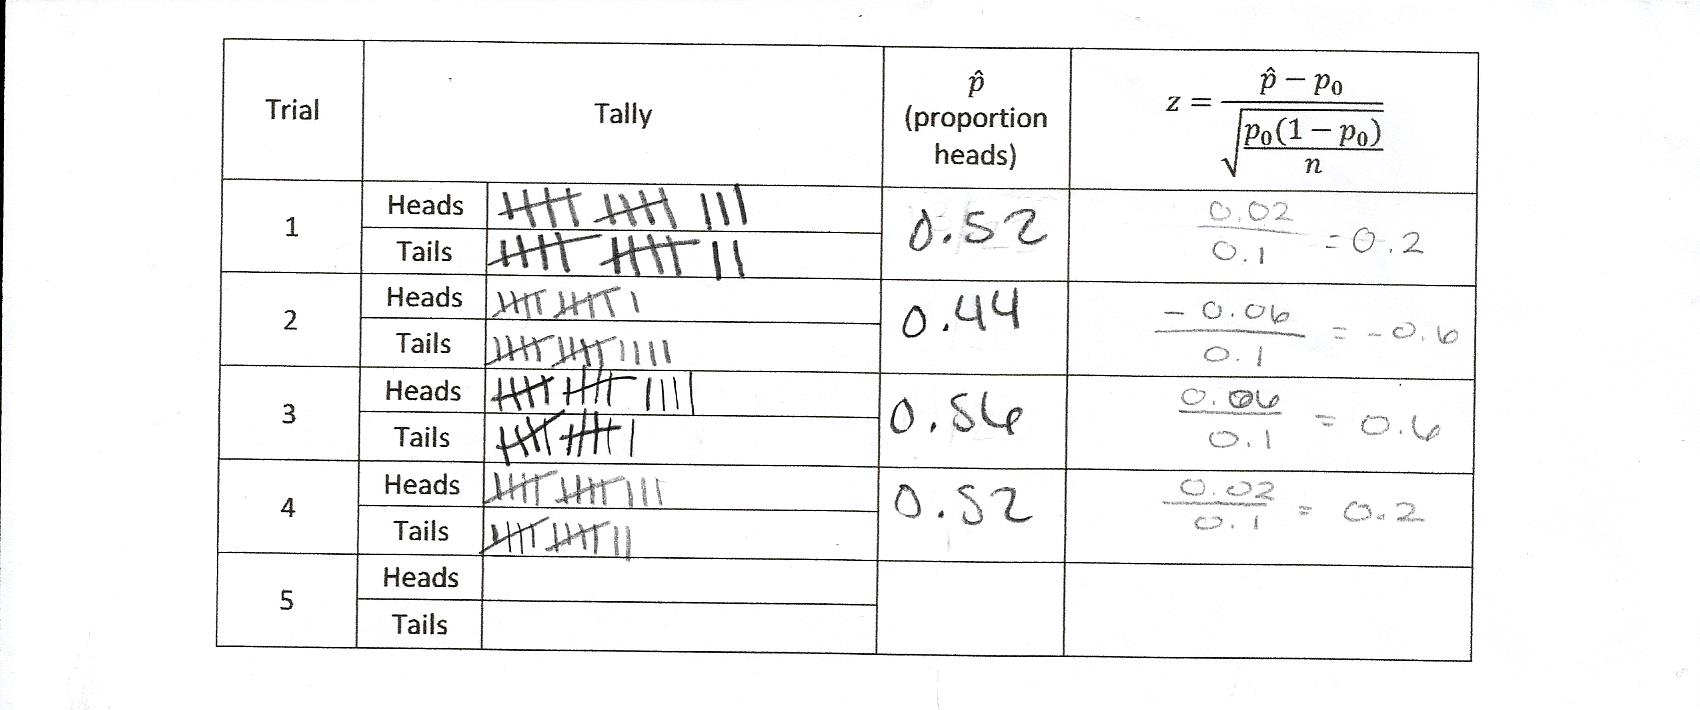
Figure 1: A table filled in by a team of two students as they worked through the hands-on simulation involving coin flips
Last week, we explored the concept of power by testing possibly unfair spinners. For this activity, the working groups were composed of four members: the all-knowing spinner, the calculator operator, the graph specialist, and the honorable judge. In addition to speeding up the process, this division of labor helped ensure that every student was included and engaged.[pullquote]…providing more structure, carefully considering how to integrate technology, and making explicit connections between concepts …[/pullquote]
- Technology should be supportive not distracting.
When I led statistics activities at the university, we met in a computer lab where a number of statistical programs were available and could be accessed quickly and easily. In a high school classroom, I have to be more intentional about integrating technology in a way that supports understanding and doesn’t distract from the statistical concepts. In some cases, students carry out low-tech, hands-on simulations themselves, then we examine the results of a computer simulation as a large group. In other cases, students use applets (such as those available through the Rossman/Chance Applet Collection) that are freely available and don’t have a steep learning curve. Javascript versions of these applets are functional on devices like phones and tablets that can be “woken up” and put away quickly.
- It’s all about connections.
My students’ final assessment – the AP Statistics Exam – focuses primarily on traditional inference (z-tests, t-tests, etc.), and I believe that simulation-based inference has the potential to improve their understanding of those traditional tests as well. However, I’ve found that connections between the two models of inference may not be immediately obvious to students, and it helps to provide a framework for explicit connections.
For example, throughout the semester we carry out simulation-based inference by choosing a statistic to summarize our results, simulating values of the statistic that could have occurred by chance alone, then comparing our results to the distribution of outcomes from the “just by chance” model. However, students may not recognize how smooth density curves like the distribution and the distribution connect to the logic of inference.
To illustrate how the Standard Normal distribution is connected to a simulated sampling distribution, my students calculated two different statistics – ![]() and the test statistic – for each of their simulated samples in the Bob/Tim example described above. Then they created class dotplots of the statistics’ sampling distributions; see Figure 2. Each dot sticker is labeled
and the test statistic – for each of their simulated samples in the Bob/Tim example described above. Then they created class dotplots of the statistics’ sampling distributions; see Figure 2. Each dot sticker is labeled ![]() or z as a reminder that each dot represents a statistic calculated from a sample. The visual building-up of a distribution centered at 0 and ranging from about -3 to 3 suggests that the Standard Normal can be used to approximate the distribution of z statistics when everyone is just guessing. These representations illustrate how counting simulated samples more extreme than ours and using a density function to estimate area in the tails are really two ways to do the same thing – quantify the strength of evidence against the null hypothesis and in favor of the alternative hypothesis.
or z as a reminder that each dot represents a statistic calculated from a sample. The visual building-up of a distribution centered at 0 and ranging from about -3 to 3 suggests that the Standard Normal can be used to approximate the distribution of z statistics when everyone is just guessing. These representations illustrate how counting simulated samples more extreme than ours and using a density function to estimate area in the tails are really two ways to do the same thing – quantify the strength of evidence against the null hypothesis and in favor of the alternative hypothesis.
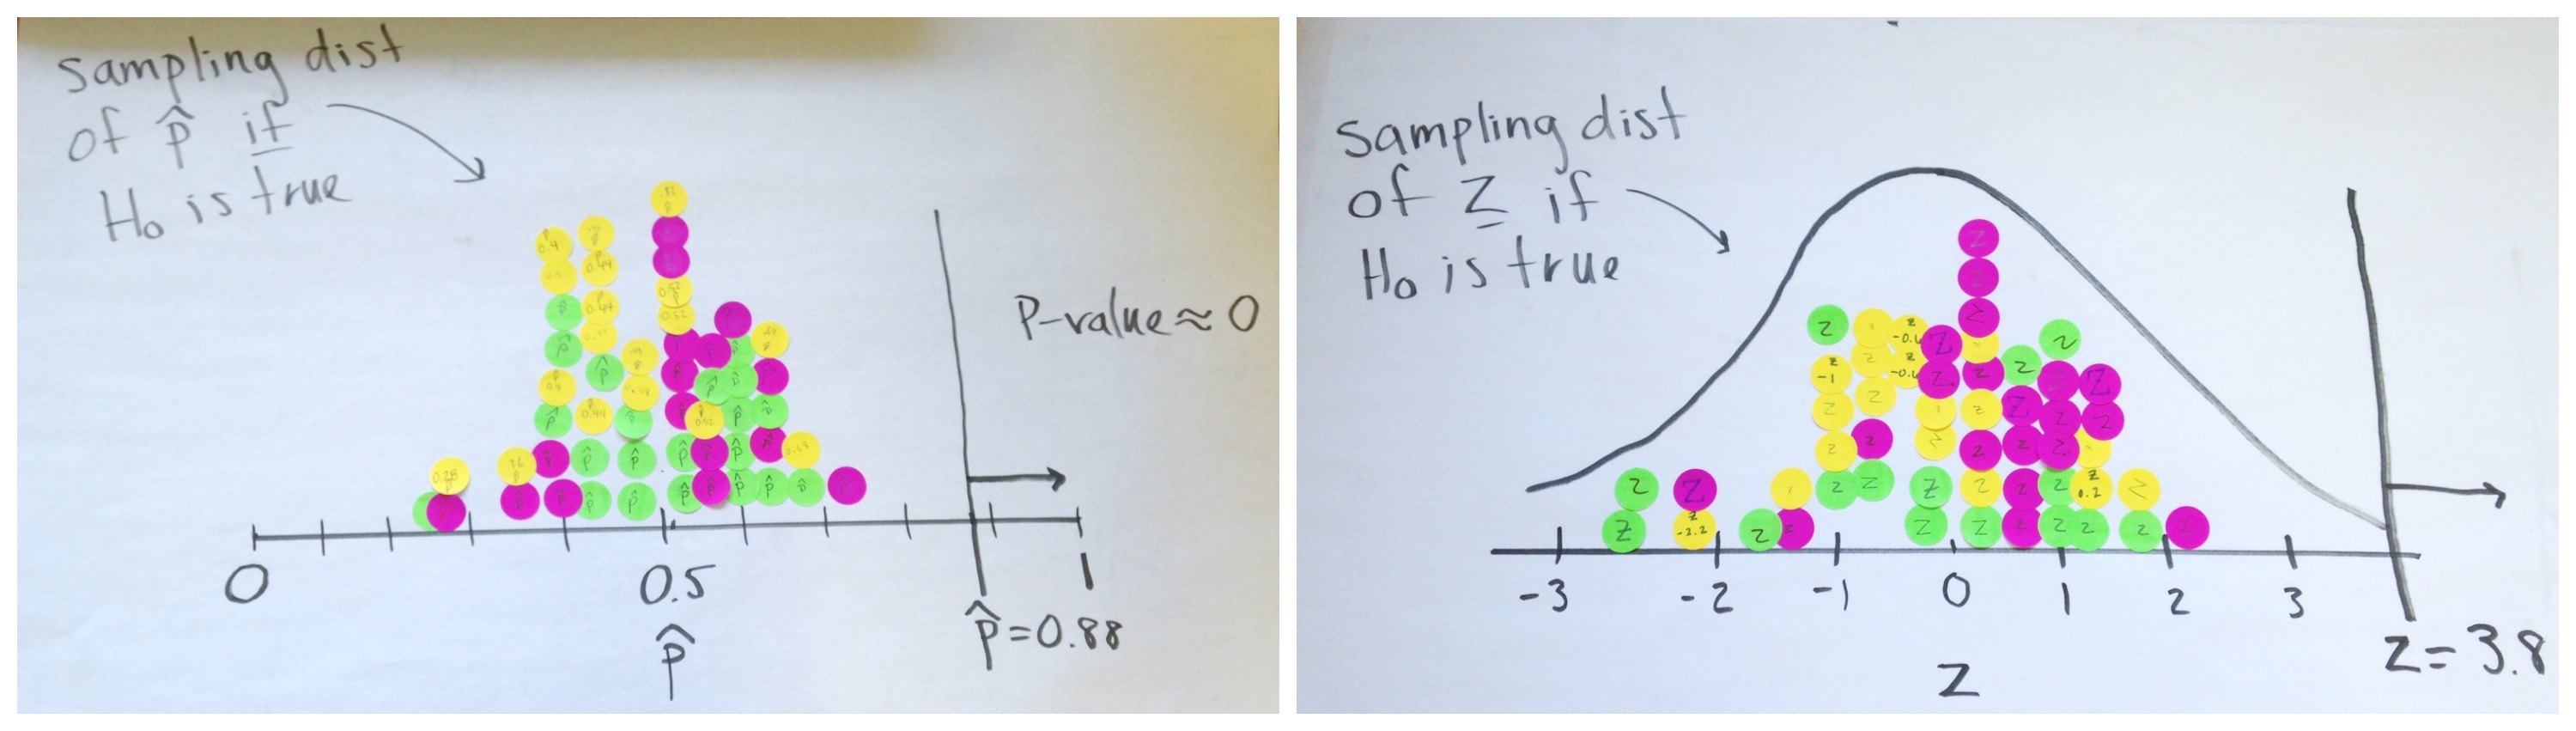
Figure 2: Dotplots displaying the sampling distribution of sample proportions (on the left) and z-statistics (on the right)
Note: Please forgive the inaccurately drawn Standard Normal curve with the fat tails. Rest assured that my students don’t let me get away with anything!
Incorporating simulation-based inference in a high school statistics class presents a set of challenges, but it also presents opportunities for students to make connections and gain experience with statistical inference throughout the course. I’ve found that providing more structure, carefully considering how to integrate technology, and making explicit connections between concepts helps keep the focus on the logic of inference and the statistical-problem solving process.
I’d love to hear about other teachers’ experiences! What challenges have you encountered using simulation-based inference with high school students? What solutions have you found?