
Robert Lochel, Hatboro-Horsham High School

The Advanced Placement Statistics curriculum contains many natural opportunities for students to demonstrate their understanding through projects. In my course, students complete three major projects during the year: an “old wives’ tale” experimental design project, a casino game design project, and a final comprehensive project after the AP exam in May. Balancing my desire to have students think critically and creatively about a research question, while providing some structure to help students reach clear assessment targets, isn’t always easy. Here are some suggestions for helping teachers design project-based learning experiences.[pullquote] … this was a “what if” we could have avoided by clearly defining each stage of the project before collecting data. [/pullquote]
Use everyday opportunities to generate research questions. Students often struggle to develop a research question which is simple enough to study, yet complex enough to generate meaningful discussion. Recently, I observed a pair of students working on an assignment in our computer lab. Most of the content of the assignment was complete, and the partnership toyed with font and spacing options before submitting. I wondered out loud whether teachers grade assignments differently based on font choice. Would two assignments with identical content receive different grades if one used Times Roman, while another used Comic Sans? This led to a spirited larger-group discussion of how we could carry out such an experiment. Ideas for stats projects abound – in our daily lives, in the news, on the internet. My first suggestion is to maintain an idea board of project ideas for students to view as they enter discussion in your classroom. This can be either a physical board, with ideas written on index cards, or an online sharing board, housed with a Google Doc or Padlet board.
Provide reflection opportunities throughout the project period. For all projects my classes complete during the year, there is always a “pit stop” assessment half-way through the assignment time period. The pit stop asks students to report on the progress of their project – What has been completed? What needs to be done? What adaptations or changes have taken place since the original concept? Rarely is a project completed seamlessly, and the pit-stop avoids much last-minute cramming.
Think about the “what-ifs.” Before my students begin submitting proposals for their final project, I warn them that I will probably shoot down their first 3 ideas. I’m not a mean-spirited person by nature, but I am good at playing devil’s advocate with my students, and will immediately think of a laundry list of things which could go wrong with a stats project. Students need to think about their project beyond a concept, and flesh out all stages before collecting data – How will the data be collected? What exactly is being measured? How will the data be analyzed? And how does the result provide evidence towards the research question?
A few years ago, an ambitious group tested the effectiveness of Oxy Clean in removing clothing stains. The partnership did a fantastic job with collecting data: identical t-shirts were cut into smaller squares, stains were applied uniformly to the samples using ketchup and lipstick, and samples assigned randomly to treatments. The cleaned samples were then neatly organized into groups when it occurred to both the partnership and me that we had no defined method for assessing the remaining stains, which varied only slightly from sample to sample. After a few days of brainstorming, we did assemble a method which involved training some volunteers, but this was a “what if” we could have avoided by clearly defining each stage of the project before collecting data.
Utilize peer evaluations. During our unit on Experimental Design, students consider an “old wives tale” and design an experiment which could test the claim. For example, think “chicken soup helps cure a cold” or “haste makes waste.” Students assemble 8-10 slides which explain the design of their experiment, and all slides are then shared online on the class website. While the teacher assesses each project, students are given the task of assessing three projects of their peers, providing feedback through a Google Form which asks evaluators to assess the project on specific descriptors. The peer feedback is then given back to the student teams. Having students evaluate the work of their peers provides additional opportunity for demonstrating understanding of statistical concepts. Peer reviews also raise the bar for all students, as students can compare the quality of their submissions against all projects in the class.
Provide opportunity for students to “share out” their findings. The first time I required students to complete a final project in AP Statistics, students shared their findings with a formal presentation in front of the class. Whereas this allowed students to explain their projects and take ownership in them, I sought a more interactive experience between students and evaluators. Now, all students participate in a year-ending Stats Fair, where invited guests 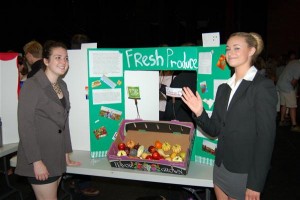 browse projects, speak with students and assess application of statistical concepts. It’s an exciting way to end the year, and you can see a highlight video from the 2014 version on YouTube (Hatboro-Horsham Stats Fair). In addition, project and poster contests from the American Statistical Association also provide opportunity for students to share their work.