
 Soma Roy – Cal Poly, San Luis Obispo
One of the great advantages of using simulation and randomization methods to introduce statistical inference is that because it does not rely on a formal discussion of probability, you can start the discussion of the logic of inference as early as day one! And, I choose to do just that. [pullquote]We find ourselves convinced that observed results did not happen by chance alone[/pullquote]
To motivate the concept of statistical significance, I am deliberate about choosing an example/study that meets the following criteria:
- I use an example based on a real study with an interesting research question – it is important to demonstrate to students that Statistics helps us answer questions about the real world.
- I use a context that involves a simple 50-50 scenario for the null model, and one in which the observed result is quite clearly in the tail of the null distribution. Also, the alternative hypothesis is one-sided.
- I avoid using formal terms such as null hypothesis, alternative hypothesis, p-value, statistical significance, and so on, and instead focus on guiding students’ intuition to investigate the question, “Are the study results surprising to have happened by chance alone?”
- I choose a study where the sample size is small enough that students can quickly conduct the tactile simulation in class.
Keeping this in mind, an example of a study my students may see in class on day one asks the research question, “Can chimpanzees solve problems?” In 1978, researchers Premack and Woodruff reported a study in Science magazine where an adult chimpanzee named Sarah was shown videotapes of eight different scenarios of a human being faced with a problem. After each videotape showing, she was presented with two photographs, one of which depicted a correct solution to the problem. For example, if the videotape showed the human unable to extricate himself from a locked cage, the photograph with the correct solution showed a key (see Figure 1).

Figure 1: The above photograph is excerpted from Premack, D. and Woodruff, G. (1978), “Chimpanzee problem-solving: A test for comprehension,” Science 3, vol 202(4367), pp. 532-535
Sarah picked the photograph with the correct solution for seven of the eight problems.
At this point I ask students to identify two possible explanations for Sarah getting 7 correct answers out of 8. With some guidance students are able to arrive at the two possible explanations being: (1) Sarah was just guessing and got lucky, and (2) Sarah has some problem solving ability and can do better than just guessing. Then I ask, “Which explanation do you think is a better explanation for Sarah’s performance on the given task?” Almost always students pick explanation (2), which leads to the follow-up question, “How will you convince someone that (1) is not the better explanation?” Some students suggest asking Sarah more questions, but I point out that because this a very old study we no longer have the choice of asking Sarah more questions; we need to do the best we can with the data we have. Students then discuss ways to refute explanation (1), and suggest looking at what Sarah’s results could have been if she just guesses. Almost always students can figure out that tossing a coin can model “just guessing.” As a class we discuss why guessing between two choices is equivalent to flipping a coin, and we define “heads” as getting the answer correct. Of course, the choice of “heads” as correct is arbitrary. Next, we talk about what the expected number of correct answers (“heads”) would be if Sarah were just guessing (“flipping a coin”) on all 8 questions, and how even though we expect this value to be 4 (half of 8), we know not every set of 8 coin tosses results in 4 heads – that result will vary, and we need to repeat the set of 8 tosses several times to generate the pattern for correct answers (“heads” out of 8 tosses) that can happen in the long-run.
Thus, having established that we need to mimic what happened in the actual study, but assuming Sarah is just guessing, the class conducts a tactile simulation with each student tossing a coin 8 times to generate possible values for the number of correct answers Sarah could have made (out of 8) just by guessing. Students then combine their findings by making a dotplot of their individual simulation results on the chalkboard. We discuss what the dotplot displays: the label on the x-axis (in this case, the number of correct answers or the number of heads); where the graph centers (in this case, 4) and discuss why that should not surprise us; not every set of 8 tosses resulted in 4 heads – there is always chance variability. Next, we make note of where Sarah’s actual result (7 correct out of 8) is on this graph. This result is seen to be very rare, and in right tail of the distribution of results that could have been, had Sarah been guessing. Thus, indicating that Sarah’s result is very surprising to have happened if she were just guessing. So, we are fairly convinced that Sarah is doing better than just guessing. We also discuss that had Sarah got 5 out of 8 correct, we would not be as convinced of Sarah’s ability to do better than guess, because 5 out 8 correct (“heads”) is not surprising to happen by chance alone.
Depending on the class size the number of repetitions of the tactile simulation can be fairly low, and I use this to motivate the use of the One Proportion applet from the ISI applet collection, to increase the number of repetitions to 1000 or even higher to generate the long-run pattern for the number of correct guesses in 8 attempts (see Figure 2). I think doing the tactile simulation first helps students get a better understanding of what the applet is doing. However, the applet discussion takes place the in the next class period.
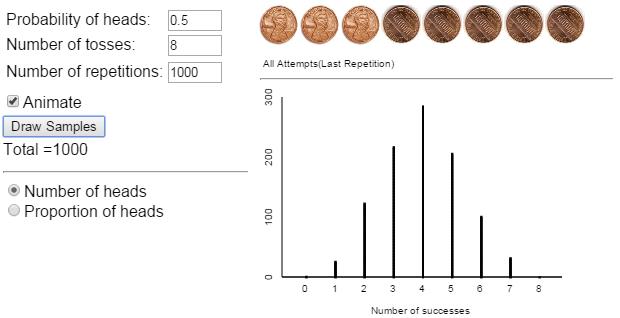
Figure 2: The above screenshot of the output from the One Proportion applet shows the null distribution of number of correct answers out of eight questions
To wrap up the class discussion on this example I point out that to evaluate whether an observed result could have happened by chance alone, we use a chance model (such as coin tossing) to simulate results that could have happened by chance, and compare the observed result to the simulated results. If the observed result is surprising to happen by chance alone, we find ourselves convinced that observed results did not happen by chance alone, and something other than random chance is at play. In other words, they now have a concrete example of the logic of statistical inference to use throughout the course.
For follow-up questions, I ask: “What if Sarah had got 14 out of 16 answers correct? Would you be more convinced or less convinced than before that she does better than just guess?” “Based on Sarah’s results, would it be okay to say that all chimpanzees do better than just guess when presented with problems like the ones presented to Sarah? Explain.”
Thus, as you saw, for the first example I am deliberate about the following points:
- Using a real and interesting study.
- Using a simple 50-50 scenario for the null model, where the observed result is quite clearly in the tail of the null distribution, and a one-sided alternative hypothesis.
- Focusing on guiding students’ intuition to investigate the question, “Are the study results surprising to have happened by chance alone?”
- Using a study with a sample size that is small enough (in this case, n = 8) that students can quickly conduct the tactile simulation in class.
Also,
- I use a dotplot (instead of a histogram) to display the sampling distribution – because a dotplot is an easier display to understand on day one, and doesn’t need much formal discussion.
- I try to strongly emphasize that the simulation does not mean redoing the study – we are just mimicking what might have happened if Sarah were just guessing.
In the next few class periods, I formalize the statistical investigation process by introducing terms such as observational units and variables (e.g., see Allan Rossman’s post), parameters, statistics, null and alternative hypotheses, and so on. After having established the core concept of the logic of inference and the statistical investigation process, the cycle repeats for situations involving non 50-50 one proportion scenarios, one mean, two proportions, and so on, to contexts involving several proportions, several means, and two quantitative variables.