
 The Catalyst Group, University of Minnesota
Matt Beckman, Ethan Brown, Bob delMas, Elizabeth Brondos Fry, Nicola Justice, Anelise Sabbag
The Catalyst group at the University of Minnesota has developed two introductory statistics courses that employ simulation-based inference methods: an undergraduate course (EPSY 3264) and a graduate course (EPSY 5261). [pullquote]Simulation-based inference has different audiences, even in the introductory course[/pullquote] The courses differ in their use of technology. EPSY 3264, which uses the CATALST curriculum, has students dive deep into the modeling process. Students build up the model themselves using TinkerPlotsTM software, and this setup process is a major part of the course. By contrast, in EPSY 5261, which uses the Lock5 textbook, the StatKey tool mostly takes care of the modeling process that is used to generate and analyze the empirical sampling distribution generated by the simulation results.
The deep modeling approach used with TinkerPlots means that students have more of an opportunity to engage with the model, but this engagement can be time-consuming. Thus, only a small range of statistical content can be covered in the course. With Lock5 and StatKey, some students may end up not understanding the modeling as thoroughly, but this frees up time to cover a greater breadth of topics by using simulation-based methods as a stepping stone to asymptotic inference strategies.
Deep modeling with TinkerPlots and CATALST
In the EPSY 3264 (undergraduate) course, TinkerPlots is used mainly to enhance student learning by helping students visualize and understand how simulations work in inferential analysis (e.g., randomization-based tests).
Students start by using TinkerPlots to create models of basic random phenomena such as flipping coins, rolling dice, or shooting basketball free throws. TinkerPlots provides a robust framework for representing models of random phenomena visually, an affordance that the course exploits throughout the semester. The software both represents a model in intuitive ways and animates the generation of trials from a model (click on image to enlarge):
Initially, students simulate a relatively small number of trials and we ask them to do a lot of interpreting results at many stages of the simulation process. We also try to help students make connections between the results and the research questions motivating each activity.
When we introduce randomization tests, students start with physical manipulatives for conducting the simulations (e.g., slips of paper for randomly assigning groups). Later, students use TinkerPlots to perform large numbers of reassignment trials and use them to answer research questions. Below is the model of a randomization test. The response variable is on the left, the group labels are on the right, and TinkerPlots is randomly assigning the group labels to each given response (click on image to enlarge):
Once the students have generated many trials, they can estimate a p–value by noting how many of the simulation results were as or more extreme than the original result from the study (here, the original result was a mean difference in groups of 2.5, resulting in a p-value of 0.12; click on image below to enlarge):
This approach means that students spend a good deal of time setting up and representing the model before they can conduct inference using the distribution of trial results. TinkerPlots does very little work for them: they have to choose the appropriate sampler and set it up for the situation at hand. We feel that the time is worth it, because students have the opportunity to see and interact with the model itself, creating the opportunity to develop a deeper understanding of the “null model” and its relationship to the distribution of sample statistics.
Leaping from the bootstrap, to randomization, to asymptotic methods with StatKey and Lock5
In the EPSY 5621 (graduate) course, simulation-based methods are covered for the first half of the semester, followed by traditional parametric methods. When introducing simulation-based methods, we typically first begin with a tactile simulation and single trials. For example, students write down the colors of M&M candies in a fun-size bag on pieces of paper. They draw the pieces of paper with replacement to create bootstrap samples to estimate the proportion of M&M’s that are blue. They move on to use StatKey to generate the bootstrap samples: first they do this one sample at a time, and see how each bootstrap sample proportion is different. Finally, they move on to conduct thousands of trials, which gives them the standard error that they need to compute their bootstrap interval.
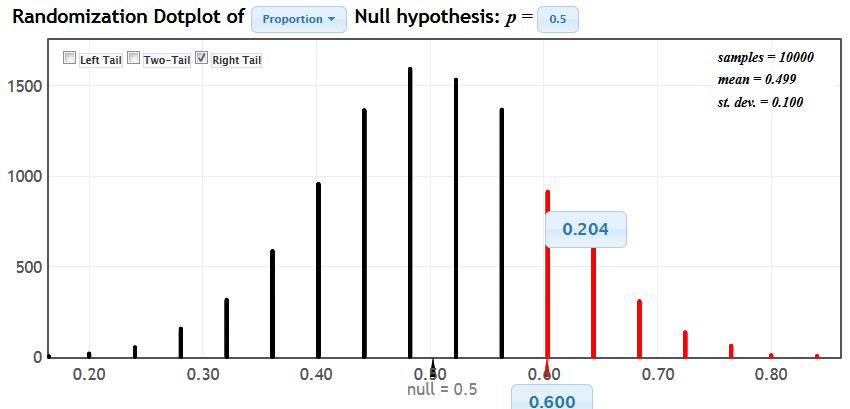
When we introduce randomization tests, we again conduct a tactile simulation with an activity called: Do you have ESP? Each student guesses the color of a card in a standard deck, 20 times with replacement, to obtain an observed proportion of correct guesses. Students then simulate random guesses by flipping a coin 20 times. Each group repeats this process 5 times and then we collect the randomization proportions from the entire class to build our own randomization distribution. Each student sees where his or her own observed proportion falls in the distribution, and computes a p-value. Using StatKey, students conduct one randomization trial and are asked to describe in detail what is happening in that trial. Then they move on to conduct thousands of trials and use StatKey to calculate the p-value. For example, a student who guessed 12 out of 20 cards correctly (60%), would obtain a one-tailed p-value of about 0.20, as shown below (click on image to enlarge).
Each time students use StatKey for simulation-based inference, we revisit the meaning of the single trial and what a single dot in the bootstrap/randomization plot represents. In this manner, we hope students understand what is going on at each step of the process, rather than seeing StatKey as a “black box” that will crank out a confidence interval or a p-value. We emphasize the software as a tool that makes it easier to conduct many trials at a time. However, we recognize that StatKey does not visualize the modeling process as deeply as TinkerPlots does.
StatKey makes it convenient to quickly generate empirical sampling distributions to use in inference for a variety of common statistical tasks (click on image to enlarge):
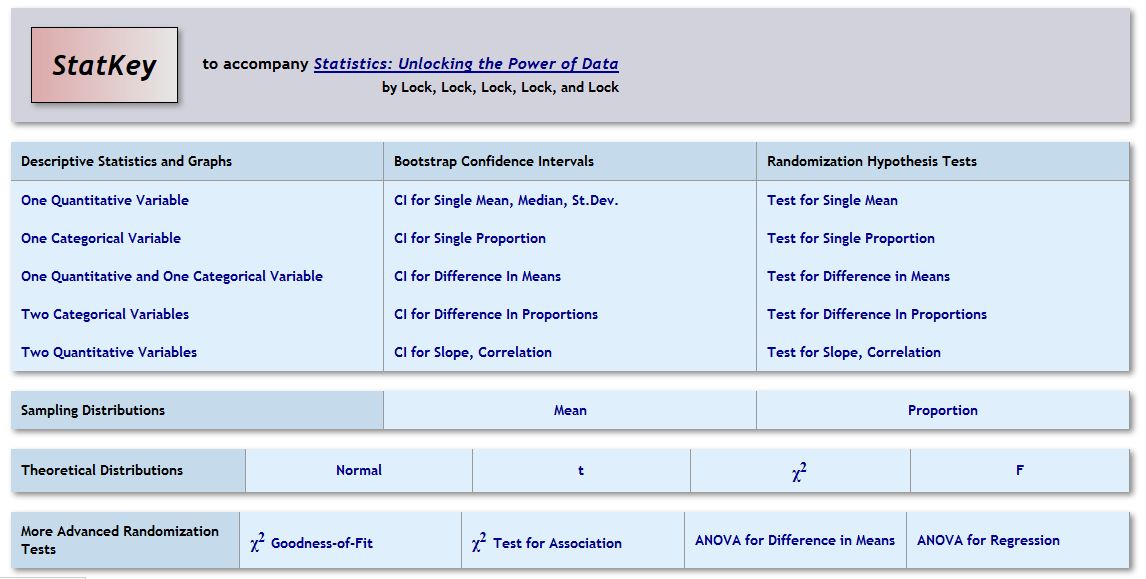
This convenience has both advantages and disadvantages. The advantage is that students can quickly delve into reasonable simulation-based analysis of a variety of data types, and can build upon this wider variety for the asymptotic approaches. The disadvantage is that students may lose track of what these distributions represent, and how they are modeled.
Simulation-based inference has different audiences, even in the introductory course
There is no right answer: We have seen quite a lot of evidence of positive student learning in both courses. The TinkerPlots/CATALST course lays a very strong foundation, which may be more appropriate for an undergraduate liberal education course. The StatKey/Lock5 course builds toward real-world analysis more quickly, which may be more appropriate for the graduate students who will be required to do quantitative analysis for their research and other coursework.