
 Alison Gibbs. University of Toronto
In Canada, school curricula differ by province, but most Canadian mathematics curricula include glimpses of statistical thinking, typically in the middle grades. In the province of Ontario, tracing the statistics part of the curriculum through the grades reveals a progression in sophistication of tools for summarizing data, with some scattered mentions of the ideas of informal inference. Students are encouraged to make inferences from their observations, but typically without tools to support their generalizability. Teachers are aware that there are important statistical ideas their students need to understand to do this well. For example, they know that a larger sample size is usually better, but they don’t know how to show their students the effects of sample size on the inferences they can make. In addition, teachers often have the challenge of irregular access to technology and uneven expertise and support. In this context, I recently worked with a group of 15 middle school teachers on an activity that uses multiple random samples to better understand the effect of sample size, with only minimal need for technology.[pullquote]With the random sampler, students can draw random samples of data from the accumulated databases of questionnaire responses from students from participating countries. [/pullquote]
The activity starts with class participation in Census at School. Census at School is an international project designed to engage school students and their teachers in learning activities that are both interesting to the students and promote the advancement of statistical thinking. Participating students complete a questionnaire that has been designed to provide data of various types for analysis and to provoke interesting questions to investigate. In Canada, the Census at School project is operated by the Statistical Society of Canada at www.censusatschool.ca; in the US, the project is operated by the American Statistical Association at www.amstat.org/censusatschool.
My favorite feature of Census at School, the random sampler, is underused by many teachers. With the random sampler, students can draw random samples of data from the accumulated databases of questionnaire responses from students from participating countries. They can explore how their class compares to a sample of students from their own country or another part of the world, how statistics vary from random sample to random sample, and use these explorations to consider some aspects of the confidence they should have in their inferences. Random samples from American students can be drawn at https://www.amstat.org/censusatschool/RandomSampleForm.cfm. And random samples from other participating countries, including Canada, can be drawn at http://datatool.censusatschool.org.uk/datatool.swf
On the Census at School questionnaire, students are asked if they are right-handed, left-handed or ambidextrous. It is common knowledge that right-handedness is by far the most common, but are there differences by sex? In this activity, we investigated whether boys and girls are equally likely to be right-handed.
The activity progresses from looking at the relevant data from one class (one small sample), comparing that to national data (one large sample), and then exploring what values are possible from many random samples, representing various classes.
After calculating the frequency and relative frequency of right-handedness for boys and girls in their class, students can consider whether or not they have evidence that the either sex is more likely to be right-handed. Students’ intuition typically makes them uncomfortable with making general statements from their class data and discussion can elicit whether their class data is both sufficiently representative and whether it includes enough observations. The Canadian Census at School project publishes summary statistics each year for all participating Canadian students and the students can compare their class result to the relevant Canadian summary statistics. They can consider why there might be differences, and whether their class results or the Canadian results give a more compelling argument for a general statement about whether boys or girls are more likely to be right-handed.
Examining repeated samples from the Census at School database forms the final part of the activity. This allows the students to consider how the percentages of right-handed boys and girls might vary from class to class. Students can start by considering randomly chosen classes of 20 students, 10 girls and 10 boys, by using the Census at School random sampler to have each student collect his or her own sample of 10 girls and 10 boys from the Canadian data the same age as their class, or have a randomly chosen “class” provided to each student by the teacher. They can discuss the type of graphical display that would best illustrate the results, including the comparison between boys and girls. Figure 1 shows a low-tech possibility; to create it, each student quickly contributes two sticky notes representing the boy and girl estimates for their sample. To see the effects of a larger sample size, students can next imagine a school with single-sex classes of size 25. They can collect random samples of a girls’ class and a boys’ class their age, with 25 students in each class, and re-create their graphical display with these new data. Figure 2 shows an example resulting plot. Even with this simple activity and a small number of samples, the effect of the number of observations on variability and the resulting ability to see differences between groups becomes clear.
The teachers at the workshop felt that they could easily adapt this activity for use with their middle school students, and were happy to have an idea for how to take their students’ statistical reasoning to a higher level.
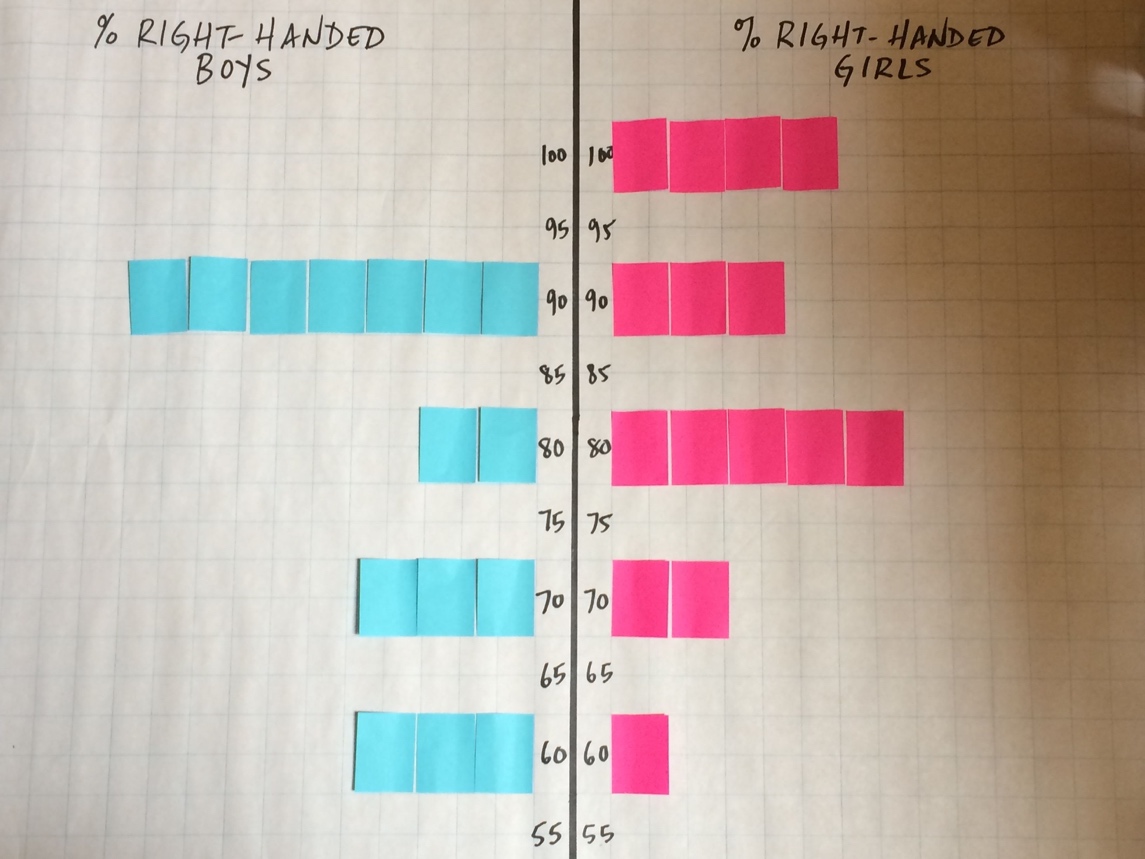
Figure 1: Comparing proportions of right-handed boys and girls in 15 samples of size 10 of grade 6 students of each sex.
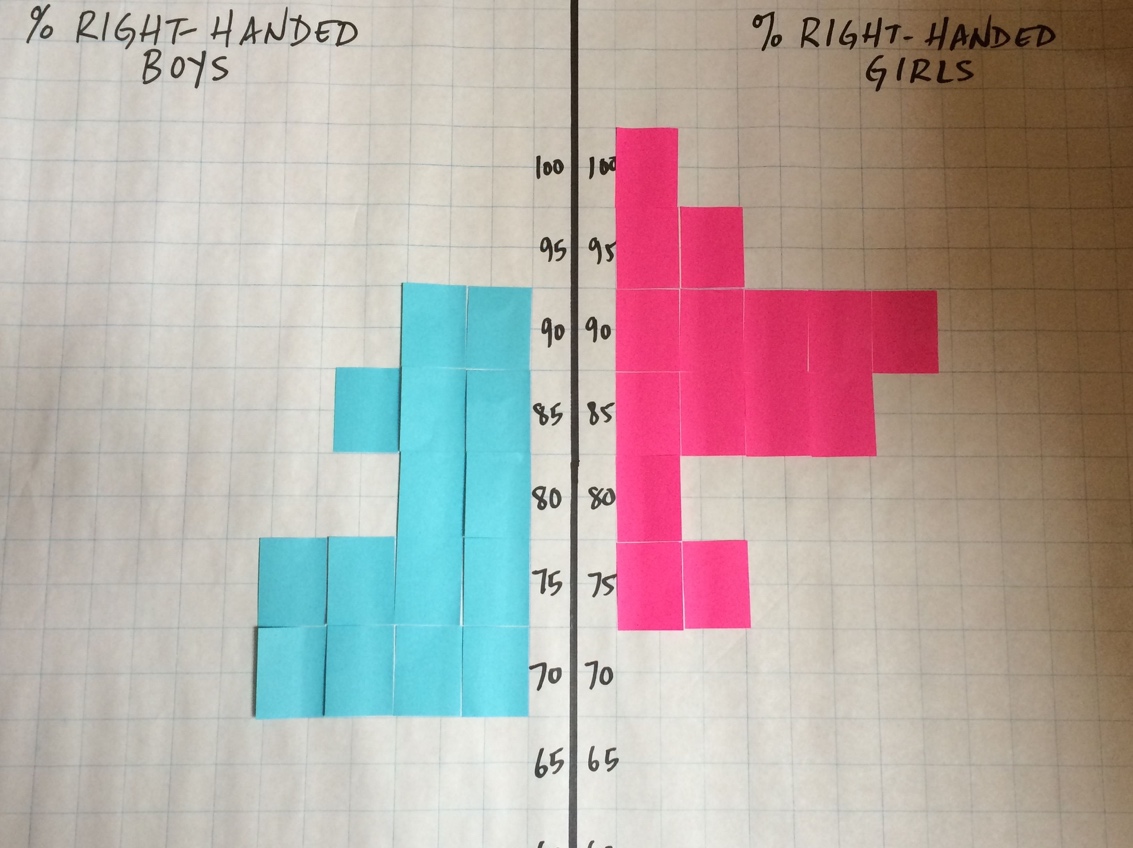
Figure 2: Comparing proportions of right-handed boys and girls in 15 samples of size 25 of grade 6 students of each sex.