
 When I am attempting to test understanding of carrying out a simulation test about a single proportion, I like to use the following problem, or some variation of it. I’m fond of animals and studies that show that animals are clever, so this study and ones like it, appeals to me.
A chimpanzee named Sarah was the subject in a study of whether chimpanzees can solve problems. Sarah was shown 30-second videos of a human actor struggling with one of several problems (for example, not able to reach bananas hanging from the ceiling). Then Sarah was shown two photographs, one that depicted a solution to the problem (like stepping onto a box) and one that did not match that scenario. Researchers watched Sarah select one of the photos, and they kept track of whether Sarah chose the correct photo depicting a solution to the problem. Sarah chose the correct photo in 7 of 8 scenarios that she was presented. In order to judge whether Sarah understands how to solve problems we will define π to be the probability Sarah will pick the photo of the correct solution. [pullquote]I don’t let them get away with just claiming that the p-value is some particular number – they have to explain how they know it is that number.[/pullquote]
- Write out the null and alternative hypothesis for this study (in words and/or symbols).
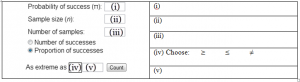
- If you conduct a test of significance using simulation, what values would you use in the one-proportion applet?
- Assume you conduct a test of significance using simulation and get the following null distribution. (Note: this null distribution uses only 100 simulated samples and not the usual 1000 or 5000.) Based on the null distribution, what is the p-value for the test? Circle the p-value on the plot.
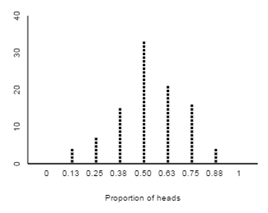
- Based on your p-value, do you have strong evidence that Sarah is not just guessing about which photograph belongs to each scenario? Explain briefly.
- What does a single dot represent in the null distribution shown above?

- A simulation for the results of Sarah completing one trial, if she chooses the correct picture half of the time in the long run.
- A simulation for the results of Sarah completing one trial, if she chooses the correct picture more than half the time in the long run.
- A simulation for the proportion of times Sarah chooses the correct pictures out of 8, if she chooses the correct picture half the time in the long run.
- A simulation for the proportion of times Sarah chooses the correct picture out of 8, if she chooses the correct picture more than half of the times in the long run.
Of course there are many more important reasons that I like this question. It asks the students to write the null and alternative hypotheses. They can only do this if they understand that the null hypothesis is the “by chance” model – if they understand that the null hypothesis is that Sarah is just guessing about which picture is correct. And they need to put the hypotheses in context in order to decide whether we should use a one-sided or two-sided alternative in this situation. And just in case they can write the correct null hypothesis, but don’t understand how that hypothesis is used in the simulation, I ask them to tell me what value is placed in each of the boxes of the applet.
This is usually tough for the students. They often get confused early in the course about where π and p̂ are supposed to go. What are the differences in these values? What happens when they put the same values in both the first and last box? (I often ask them that on a quiz too. Sometimes I even ask what the p-value would be if π = p̂.) Actually, they usually want to put 0.5 in the first box every time they use the applet. So I wish I could come up with more problems where the “by chance” model didn’t have π = ½, but instead had π = ⅓, or π = ¼, or some other value. There are some examples in the ISI textbook (adjustments on Rock/Paper/Scissors for example) that I do use, but sometimes the backgrounds are too complicated for testing environments.
Later in the course I would expect them to define the parameter π in words, but at this point, they are usually still having trouble with that. So I define it for them. I do, however, expect them to recognize that they need to convert from the count of 7 successes to the sample proportion of ⅞ = 0.875. I also expect them to know where to put this in the applet, and most importantly, I expect them to know that this is the critical part of finding the p-value. They need to be able to find that value on the horizontal axis of the null distribution, count the dots above that value, and divide that number of dots by 100. I am always tickled when they can do this early in the course. If they can’t do this, I need to do some more work with them.
I usually have a question similar to this on each test and the final exam. The context changes, and the parameter(s)/variable(s) changes, but I give them a null distribution and few enough dots that they can count (or a statistic far enough in the tail that they can see the p-value is zero). I don’t let them get away with just claiming that the p-value is some particular number – they have to explain how they know it is that number. By the end of the course, nearly every student who is attending class and really wants to pass can answer that question. Many can even extend to a new context that they haven’t seen before, for example with a new statistic such as the mean/median.
The last, multiple choice part of this question tries to make sure that the students understand exactly what the null distribution represents. There are lots of different ways I might ask this over course of a semester. By the end of the semester, I’m usually asking them to tell me what one dot on the plot represents. But early on, I like to give them options from which to choose. The distinctions between choices may be subtle. And they can lead to lively discussions about how the null distribution is a plot of outcomes assuming the null hypothesis is true, not of what might happen if the alternative hypothesis is true.
An additional question I sometimes ask is what do they expect the center of this null distribution to be? I’ve even given them several plots to choose from (usually after we’ve learned more about spreads). But they should always know that the center should be roughly what they are assuming π to be in the null distribution. In this case, with the small sample size, they should expect the spread to be fairly large.
Of course all of my student assessments are works in progress. Every time I administer one, I learn about improvements I can make the next time. But I’m sure I’ll continue to provide null distributions and ask students to show me and estimate the p-value on that distribution.
thanks for information