Peer-Reviewed Contributed Posters
(alphabetical order by lead author name)
"Intuitive Analysis of Variance: Effect of Different Data Sets and Presentation Types"
Sait Atas, University of Ottawa
David L. Trumpower, University of Ottawa
Mehmet Filiz, University of OttawaPreviously, it has been found that students tend to perceive the difference between group means as being more important than the consistency of those differences when engaged in an intuitive analysis of variance (ANOVA) task, even though both are equally important in a formal statistical sense. However, the reason behind this tendency is not known. Therefore, the purpose of the present study was to explore one factor (numerical versus graphical presentation of data sets) that could play a role in students' tendency to place more weight on between group variability. Graduate students enrolled in an introductory level statistics course were shown a series of hypothetical data sets, each comprised of scores from two independent groups. Some of the data sets were presented numerically and others graphically. Students were asked to rate the strength of evidence provided by each data set against a null hypothesis of no difference between the groups, and to provide explanations for their ratings. Results indicate that students place more importance on the magnitude of group mean differences than the consistency of the differences, regardless of whether data are presented numerically or graphically. Implications for teaching ANOVA are discussed.
"The Blame Game: Developing Autonomous Learners in Introductory Statistics"
Melanie Autin, Western Kentucky University
This study examines the influence of instruction method on student learning. One section of undergraduate introductory statistics was taught using a teacher-centered, lecture-based approach, and one section was taught using a student-centered collaborative-learning approach. Though quantitatively there appeared to be no significant difference between the two courses (in terms of final exam and final course grades), qualitatively there were major differences in the results of students' perceptions of their learning in both classes. The findings presented via this poster focus on the development of autonomous learners. In particular, students in the non-lecture class were required to take more responsibility for their own learning, whereas much of that responsibility seemed to fall on the instructors' shoulders in the lecture-based class. Consequently, students in the non-lecture class tended to attribute their successes to themselves, whereas students in the lecture class gave credit for their successes to the instructor. On the other hand, students in the lecture class claimed responsibility for their shortcomings in learning, whereas students in the non-lecture class blamed the instructor. The experiences of both the students and the instructor will be presented.
"Implementing an Activity-Driven Statistics Curriculum and Meeting QL Requirements"
Rachel Barnett, Bowling Green State University
Beth Burns, Bowling Green State University
Jim Albert, Bowling Green State UniversityBowling Green State University has a new quantitative literacy requirement and MATH 1150 Introduction to Statistics has seen a dramatic increase in enrollment. In the 2011-2012 academic year, nearly 2000 students from diverse backgrounds and interests were enrolled in this course. Given the importance of statistical thinking in our information-driven world, MATH 1150 has the opportunity to impact a large number of students in a positive way. At Bowling Green State University, there are five criteria for a course to be considered a quantitative literacy course.
- Interpret mathematical and statistical models such as formulas, graphs, tables, and schematics, and draw inferences from them.
- Represent mathematical and statistical information symbolically, visually, numerically, and verbally.
- Use arithmetical, algebraic, geometric and statistical methods to solve problems.
- Estimate and check answers to mathematical problems in order to determine reasonableness, identify alternatives, and select optimal results.
- Recognize that mathematical and statistical methods are based on assumptions and have limits.
By following these criteria and incorporating them into our activity based lessons, we hope to attain a course that not only continues to meet the requirements for quantitative literacy, but also one where students better understand statistical concepts
Two lab activities have been developed and tested for the MATH 1150 course. The first lab activity requires students to create their own graphs, explore what types of graphs are appropriate for categorical and quantitative data, and find suitable numerical summaries. At the end of the lab, students answer questions on the primary statistical concepts. In a second lab, students create scatterplots and numerical summaries with two quantitative variables and answer research questions. Learning about the statistical concepts is assessed through questions at the end of the lab. In analyzing pre and post test scores, the labs appear to be effective in communicating the main statistical concepts. This data will inform adjustments to the questions for clarity and the development of new lab activities.
"Coordinating Introductory Statistics Instruction"
Rachel Barnett, Bowling Green State University
Beth Burns, Bowling Green State University
Jim Albert, Bowling Green State UniversityOne challenge in teaching MATH 1150 Introduction to Statistics is the coordination of a large number of sections with a mix of instructors, many who are graduate students who are inexperienced in teaching statistics. Without some careful coordination plan, the quality of instruction among sections can be variable. As part of the course redesign of MATH 1150, we outline the goals of good coordination and describe some of the detailed daily lesson plans with carefully planned activities and labs for use by both graduate students and instructors.
"Creating Data Analysts: Enabling Students to Conduct Meaningful Analysis by Combining Technology and Real Data"
Kyle Barriger, Castilleja School
Mia Stephens, JMP SoftwareExamples of student presentations will anchor this poster highlighting what is possible in an introductory data analysis unit when high school students are introduced to technology and real data. The design of this unit was based on three important premises. The first, articulated by David Moore, is that data analysis should precede the teaching of other statistical skills since a solid conceptual understanding of data is essential to building those skills. The use of real and meaningful data is the second premise. This approach supports the idea espoused by Willet and Singer that real data teaches students not only how data is analyzed but also why it is done. Finally, the use of technology needs to be designed to enable students to explore data and not just automate procedures. This was one of the implications for teaching statistics that Joan Garfield uncovered in her work.
Throughout this data analysis unit, students deepen their understanding through analyzing real data (including data from Census at School) and using technology (JMP) to enable them to conduct meaningful analysis. Student learning is reinforced with a weekly introduction to a new aspect of JMP. Students are then expected to use JMP and complete a technology assignment that consists of both demonstration and analysis activities. At the completion of this unit, they analyze some aspect of the Census at School data using a dataset with over 800 observations.
"Providing Marriage Counseling for the Union of Mathematics and Statistics in the Classroom: The Case of Line of Best Fit"
Stephanie Casey, Eastern Michigan University
Jennifer Kaplan, The University of Georgia"Interpret the value of the slope (0.133) in the context of the problem." A correct mathematical answer to the question might be "When we increase the swine population by 1000, the amount of ammonia in the atmosphere will increase by 0.133 parts per million." This would not, however, be considered a statistically correct answer because it neither attends to the variability of predictions using linear models nor differentiates between association and causation.
This is one example of conflicts that arise when the teaching of linear functions, from a mathematical perspective, and bivariate data analysis (or regression), from a statistical perspective, are married in the classroom. In our poster, we will present more examples of such differences that occur in high school classrooms, derived from analysis of the teaching of the topic through an illustrative case study. We will also share portions of mathematics curricula that teach the line of best fit along with our critical analysis of the curriculum authors' presentation of the topic. The recent report, The Mathematical Education of Teachers II, published by the Conference Board of Mathematical Sciences (CBMS, 2012) recommends that more statistics faculty in the U.S. become involved in the preparation of K-12 mathematics teachers. This is necessary to ensure that the Common Core State Standards (Common Core State Standards Initiative, 2010) for probability and statistics are implemented effectively nationwide. Our poster will provide an opportunity for statisticians and statistics educators to learn more about the needs within teacher preparation and how they can help prepare future K-12 teachers whose coursework emphasizes mathematics to teach statistics effectively.
Next to the poster we will have a laptop running a java applet (see www.ruf.rice.edu/~lane/stat_sim/reg_by_eye) that allows users to create lines of best fit by eye then compare their line with the least-squares regression line. Participants will be engaged actively in drawing a best fit line, which will spark conversation with us about what factors they considered (and students might consider) when drawing their own line as well as potential differences between their line and the least-squares regression line. Thus, our poster will provide an opportunity for participants to experience the type of work done professionally by classroom teachers when they teach the topic of line of best fit.
References:
Casey, S.A., & Kaplan, J. J. (under review). Statistical knowledge for teaching: The case of informal line of best fit. Journal of Mathematics Teacher Education.
Common Core State Standards Initiative. (2010). Common core state standards for mathematics. Washington, D.C.: Author.
Conference Board of the Mathematical Sciences (2012). The Mathematical Education of Teachers II. Providence, RI: American Mathematical Society.
Kaplan, J.J. & Casey, S.A. (in progress). Considering the marriage of mathematics and statistics in the classroom: The case of bivariate association. Journal of Research in Mathematics Education."Developing Informal Inference in the Middle Grades Through Exemplary Tasks"
Kayla Chandler, North Carolina State University
Tamar Avineri, North Carolina State University
Jennifer Nickell, North Carolina State UniversityThis poster session will demonstrate three exemplary tasks adapted from research on a suggested sequence of developing informal inference in the middle grades. Zieffler, Garfield, delMas, and Reading (2008) present a comprehensive and thorough working definition of informal inferential reasoning as "the way in which students use their informal statistical knowledge to make arguments to support inferences about unknown populations based on observed samples" (p. 44). They add that such reasoning is performed through a "process" in which students consider attributes of graphical displays of data (e.g. distribution, measures of center), interpret those attributes in context, compare populations based on representative samples, and test the reasonableness of the outcomes of those data (Zieffler et al., 2008). Our tasks were selected and adapted to accommodate this definition and to align with the suggested sequence by Garfield and Ben-Zvi (2008). The tasks we will share include the incorporation of TinkerPlots, Fathom, and an online applet and are aligned to the Common Core State Standards for Mathematics. Because of the incorporation of technology, we will have laptops available to display and allow for participants to engage in the activities.
With the first task, students learn the importance of understanding data to be able to make statistical arguments and inferences. In addition, students have the opportunity to choose and construct appropriate representations of their data. This activity is an important beginning task to lay the foundation to develop informal statistical inference since students are making decisions and interpreting real world data.
This second task promotes understanding of informal inference by having students compare two real data sets and develop data based arguments to support their reasoning. The use of technology in this task not only enhances the interest level of the task, but also encourages the students to approach the data in a variety of ways. Finally, this task lays the foundation for considering informal inferences on data sets of different sizes and visually considering distributions. Students also learn to consider the context when making inferences about the population at hand.
In the final task, students learn the importance of sampling randomly and the affect sampling with bias can have on the inferences they can make based on their data. Students have the opportunity to analyze repeated samples and investigate questions of variability among those samples. This task lays a foundation for further study of those descriptive measures of data and how those measures help us analyze data. The final exploration of the relationship between the variables presents students with an introduction to bivariate data analysis with a focus on drawing conclusions in context.
References
Garfield, J., & Ben-Zvi, D. (2008). Developing students' statistical reasoning: Connecting research and teaching practice. New York: Springer.
Zieffler, A., Garfield, J., delMas, R., & Reading, C. (2008). A framework to support research on informal inferential reasoning. Statistics Education Research Journal, 7(2), 40-58."How I Learned to Stop Worrying and Just Teach MBA 5800 (With Apologies to Dr. Strangelove)"
Alan S. Chesen, Wright State University
MBA 5800 is a course that is required of the MBA students at Wright State University who have never previously studied the discipline or have not attained a certain standard in the statistics courses they have taken at the undergraduate level. It is taught in an effort to bring these students up to the level of their classmates who have taken both a descriptive statistics course and an inferential statistics course in a previous academic program. It is a single three semester hour course for which students receive graduate credit. It is designed to expose these students to the material contained in the two three hour undergraduate courses that are a part of that curriculum. By completing MBA 5800, students should be able to understand the more complex statistical concepts that are contained in their other graduate level courses.
It is easy to understand that using traditional methods of teaching, one cannot cover two courses as one. Therefore, I have charged myself with developing a methodology and procedure to teach what I deem the most important concepts of the two undergraduate courses in the limited amount of time I have with this body of students. Some of these students have never previously even given any thought to studying our discipline. In the spirit of the theme of the 2009 USCOTS conference, "Letting Go to Grow," and also in the spirit of the theme of the 2013 conference, "Making Change Happen," I will share with my audience via a poster and by other means a presentation of how I teach this class in order to educate my students and how I provide them with a level of comfort that allows them to succeed in further courses that utilize basic statistical concepts and content within their programs.
"Math Digital Library - what's in it for you!"
Carolyn Cuff, Westminster College
Diane Fisher, University of Louisiana - Lafayette
Natasha Gerstenschlager, Middle Tennessee State University
Brandon R. Hanson, Middle Tennessee State University
Ginger Holmes Rowell, Middle Tennessee State UniversityMathDL is an on-line resource created and maintained by MAA. Included are peer reviewed articles, math in the news and mathematical events for this day. Links are provided to resources appropriate for use in the statistics classroom. Of special interest to USCOTS participants is the recently posted collection of reviewed resources for a probability course. The material is grouped by topics including: basic probability, conditional probability and independence; discrete and continuous distributions such as Bernoulli, binomial, and normal; expected value and correlation; convergence theorems; and randomizing gadgets. Examples of types of resources include online applets, videos, PDF files, and teaching activities. The resources are searchable by keywords including the type of resource and appropriate audience.
Resources available will be demonstrated. Stop by and pick up a card to take back to remind yourself of the URL when you return to home. mathdl.maa.org/mathDL/61/?pa=newCollection&sa=viewCoursePage&courseId=9
"How Faculty View Statistics and the Statistical Preparation of Their Students"
Kirsten Doehler, Elon University
Laura Taylor, Elon University
Jessalyn Smith, Elon UniversityWe administered a survey to faculty at seven colleges and universities in order to gather information on faculty views of statistics, their use of statistics, and perceptions of their students' statistical preparation. Responses were received from academics in numerous disciplines ranging from Arts and Humanities to Business and Management and provided information on specific statistical procedures that faculty use in teaching and in undergraduate research projects. Faculty reported on the statistical preparation of students in their classes and students whose undergraduate research they advise. Faculty from two universities offered suggestions on how statistical preparation of their students could be improved. Findings indicated that some statistical methods that are used regularly within client disciplines receive a disproportionate amount of emphasis in introductory and more advanced statistics courses. Over half of respondents recommended that additional statistics classes would be useful for students. Survey results highlight the statistical needs of other disciplines and emphasize the importance of statistical preparation needed by students taking introductory statistics courses. Based on this research we suggest that open communication between introductory statistics instructors and client disciplines is a critical step to improve the statistical preparation of students.
We administered a survey to faculty at seven colleges and universities in order to gather information on faculty views of statistics, their use of statistics, and perceptions of their students' statistical preparation. Responses were received from academics in numerous disciplines ranging from Arts and Humanities to Business and Management and provided information on specific statistical procedures that faculty use in teaching and in undergraduate research projects. Faculty reported on the statistical preparation of students in their classes and students whose undergraduate research they advise. Faculty from two universities offered suggestions on how statistical preparation of their students could be improved. Findings indicated that some statistical methods that are used regularly within client disciplines receive a disproportionate amount of emphasis in introductory and more advanced statistics courses. Over half of respondents recommended that additional statistics classes would be useful for students. Survey results highlight the statistical needs of other disciplines and emphasize the importance of statistical preparation needed by students taking introductory statistics courses. Based on this research we suggest that open communication between introductory statistics instructors and client disciplines is a critical step to improve the statistical preparation of students.
"A Suspenseful Start to the Probability Chapters in the Intro Course"
Robert Erhardt, Wake Forest University
We demonstrate an effective opening lecture to build enthusiasm for studying probability in the introductory statistics course. Two students agree to participate in a coin flipping experiment - one will flip a real coin 200 times and write out the sequence of heads and tails, the other will fake the data and write a "random" sequence of heads and tails. Both e-mail the sequences to the professor, who has announced in advance that she will determine which data are real. The traditional test is to check which sequence has the longest unbroken sequence of all heads or all tails, called a run. Students faking data often switch back and forth between heads and tails too many times, somehow believing such volatility is more "random." However, occasionally a student guesses that such data should have one large run (in past classes, we have even had participating students Google this example to learn how to deliberately trip up the professor!). We move beyond the simple "longest run" test and show how analyzing the full histogram of the lengths of runs is more effective.
This lecture works on many levels: it serves to open the probability chapters with suspense and enthusiasm; it reminds students of histogram construction and interpretation; it conveys how non-intuitive randomness can be; and finally, it provides a compelling example of effective statistical reasoning without relying on simple formulas or tests. This lecture also demonstrates the power of the re-randomization (or bootstrapping) approach to teaching Intro Statistics which has gained appeal in recent years. Every time we have used it, the students have loved it.
"How a Computer-based Concept Mapping Can Be Used In Statistics Education: A Case of ANOVA"
Mehmet Filiz, University of Ottawa
David L. Trumpower, University of Ottawa
Sait Atas, University of OttawaThis paper presents a recently developed computer-based concept mapping tool (www.conceptmapsforlearning.com), and shows how it can be used by statistics educators in a formative assessment cycle. The website was developed based on established principles of effective assessment for learning. We present an illustrative example using the topic of analysis of variance to show how teachers can use the website to assess students' conceptual understanding, provide them with individualized feedback, and engage them in meaningful remedial activities to help improve their understanding. Teachers need only to choose the set of concepts to assess. The tool automatically generates graphical feedback, as well as linked explanations, examples, problems, and reflective activities based on individual areas of weaker conceptual understanding. For further studies, we are planning to expand the variety of topics to which the tool may be applied, and to gather teachers' perceptions about the usability of the website in their courses.
"Using Personal Glossaries for Building Vocabulary in Introductory Statistics"
Amy G. Froelich, Iowa State University
Billie Siegfried, Iowa State UniversityLike any other science, statistics has its own language; its own set of vocabulary words. This language plays a crucial role in the classroom. First, we communicate the ideas of statistics through language. Our students then build their understanding of statistics through language. Finally, we assess student knowledge and understanding through the language they use (Thompson and Rubenstein, 2000). In order to show understanding of key concepts in introductory statistics, students need a working knowledge of the vocabulary words related to these concepts.
What can we do as instructors to help students learn the language of statistics? Thompson and Rubenstein (2000) suggest several instructional strategies to improve students' vocabulary acquisition. Through experimental testing, we found one these strategies, personal glossaries, is an effective tool to aid students in acquiring the vocabulary of introductory statistics. As a part of this study, we also discovered several misconceptions in student definitions of vocabulary words. In this poster, we will define and give examples of personal glossaries. We will then describe several ways in which they can be incorporated into the introductory statistics course, each requiring minimal investment of class time. Finally, we will present some of the misconceptions in student definitions of vocabulary words from our study and ideas for correcting them.
Reference:
Thompson, D.R. & Rubenstein, R.N. (2000). Learning mathematics vocabulary: potential pitfalls and instructional strategies. Mathematics Teacher, 93(7), 568-574."Alternate Sequence Textbook for Introductory Statistics"
John Gabrosek, Grand Valley State University
The reform movement in statistics teaching has led to important changes in what we teach, how we teach, and how we assess over the past 25 years in the algebra-based introductory applied statistics course. One issue largely left out of the discussion has been the order in which topics are taught. This book departs from the traditional sequence of topics in important ways. The proposed ordering of topics repeats the sequence of data collection - descriptive summaries - probabilistic reasoning - statistical inference seven times throughout the course in various data contexts.
An analysis of 17 of the most popular introductory statistics texts by Race and Gabrosek in 2005 (unpublished) revealed many differences in pedagogical approach and topic emphasis. Generally only slight differences existed in the sequence in which topics were covered. The problem with the traditional sequence is that it reinforces the student's mistaken belief that statistics is an unconnected body of knowledge made up of tricks that go under the names data collection, probability, data summary, hypothesis testing and confidence interval. Students fail to grasp the connections between these topics largely because the topics are taught separately in content and time. (Malone, C., Gabrosek, J., Curtiss, P., and Race, M., 2010. Resequencing Topics in an Introductory Applied Statistics Course. The American Statistician, Feb 2010, Vol. 64, No. 1: 52-58.)
The poster will highlight various features of the text, including structure, e-availability, supplemental resources, and available data sets.
"Making Change Happen in Mathematical Statistics"
Jennifer Green, University of Nebraska - Lincoln
Erin Blankenship, University of Nebraska - LincolnWhile change/reform has been a recurring theme in statistics education, those same reforms are not often explored in mathematical statistics. We believe that these same changes would improve the mathematical statistics curriculum, and the goal of our poster is to help the participants "Make Change Happen" in their own mathematical statistics courses.
GAISE-type reforms have been embraced by instructors of the introductory statistics course, but the same cannot be said for mathematical statistics. Nevertheless, the recommendations listed in the GAISE College Report (Garfield et al., 2005), especially those that focus on fostering active learning and emphasizing conceptual understanding, are also valuable in theoretical courses, such as mathematical statistics. However, the two-semester calculus-based undergraduate mathematical statistics sequence is typically taught in the same manner it has been for the last 50 years: as a traditional, lecture-heavy course. Students leave the sequence with a set of skills that revolve around mathematics, but with little understanding about how the theoretical concepts they have learned connect to real statistical practice. At the University of Nebraska-Lincoln, we recently revised a long-standing undergraduate mathematical statistics sequence to focus more on conceptual understanding and active learning while still including the theoretical content of probability and inference students need to be successful in subsequent statistics or actuarial science courses. Through the use of non-traditional classroom activities, as well as newly developed assignments, we are able to promote student understanding and problem solving, as opposed to mere memorization and calculation. These non-traditional materials, in conjunction with more traditional assessments, allow us to gain a more holistic picture of student understanding.
Our poster will share some of the course material we have developed to encourage and assess students' conceptual understanding of the material. Very little of the content we teach in mathematical statistics was changed to accommodate our course revision, so attendees should find it easy, but valuable, to implement a similar revision in their own courses.
"Modules for Teaching Statistics with Pedagogies using Active Learning (MTStatPAL)"
Lisa Green, Middle Tennessee State University
Scott McDaniel, Middle Tennessee State University
Nancy McCormick, Middle Tennessee State University
Jeremy Strayer, Middle Tennessee State University
Ginger Holmes Rowell, Middle Tennessee State University
Natasha Gerstenschlager, Middle Tennessee State University
Brandon Hanson, Middle Tennessee State UniversityMiddle Tennessee State University statistics education faculty are in the early stages of developing a package of ten technology-facilitated learning modules. These materials are designed to help instructors effectively use active learning to teach important concepts in introductory statistics. The learning modules include both student and instructor materials. The in-class student materials use active learning approaches as a response to the GAISE (2005) recommendations. The MTStatPAL team is also developing pre- or post-activities using the flipped classroom model to ensure students have the needed background knowledge and/or to reinforce key concepts associated with the in-class activities. The instructor materials include the traditional ancillary materials such as student handouts, objectives, directions, and a solutions guide. Moreover, instructors are provided with an example script for use during the in-class activity, a video of an experienced professor completing the activity with a class, and conceptual assessment questions with solutions. The additional instructor materials are intended to make implementing the activities easier for a teacher who is new to using active learning and/or new to teaching statistics. These modules are designed to supplement, not replace, the introductory statistics curriculum.
This poster shows results from class-testing a descriptive regression module, Regression on the Rebound (Buskirk & Young, 2001), in the Fall 2012 and Spring 2013 semesters in selected introductory statistics classes with instructors who had various levels of experience teaching this course. The project collected both quantitative and qualitative data using classroom observations, student surveys, teacher interviews, and pre- and post-test results. Come by to see the results and to explore the student and teacher materials that introduce descriptive linear regression.
References:
Aliaga, M., Cobb, G., Cuff, C., Garfield, J., Gould, R., Lock, R., Moore, T., Rossman, A., Stephenson, B., Utts, J., Velleman, P., & Witmer, J. (2005). Guidelines for Assessment and Instruction in Statistics Education (GAISE) College Report. American Statistical Society.
Buskirk, T., & Young, L. (2001). Regression on the Rebound, causeweb.org/repository/StarLibrary/activities/buskirk_young2001"Changing the Course Structure to Meet the Needs of Students in a Statistical Literacy Class: A Comparison of Attitudes, Statistical Literacy, and Performance Between Large-lecture Traditional, Fully Online, and Hybrid Sections"
Ellen Gundlach, Purdue University
Robert C. Morris, Purdue University
Kevin A. Richards, Purdue University
David B. Nelson, Purdue University
Chantal Levesque-Bristol, Purdue UniversitySTAT 113: Statistics and Society, a statistical literacy course for primarily liberal arts undergraduates, was originally taught only as a large lecture course (~500 students split into two sections). However students had complaints about the course structure, and the university considered the Drop/Withdraw/Fail (DWF) rate to be too high. Students' math anxiety and unwillingness to engage in the subject matter were additional challenges for the instructor. Some students wanted more flexibility in their schedules and the ability to learn at their own pace, so an online section of the course was added. While the traditional section worked for some students and the online section worked for others, many students requested a middle ground. Students wanted the opportunity to avoid the large lectures and learn the material at home on their own schedule but still have weekly in-person, meaningful contact with their instructor and their peers.
STAT 113 was part of a year-long course redesign program, and the course was taught in the Fall 2012 semester in three different, but closely-coordinated, formats: large-lecture traditional (~400 students split into two sections), fully online (~80 students), and hybrid (~40 students). All three formats had the same instructor, schedule, lectures (although how the students accessed the lecture content was section-dependent), online homework, in-person exams, and online article-posting/discussion social media project. The traditional students used iClicker questions during the lectures and had weekly recitations with a teaching assistant. The online students had online conversations with the instructor. The hybrid students had weekly meetings with the instructor and peers for group work and hands-on activities.
Pre- and post-evaluations of statistical literacy and attitudes towards statistics, end-of-course teaching evaluations, and student grades were used to compare the 3 formats. Students in the three formats performed comparably in all respects, but all three formats showed improvement (especially the DWF rate) when compared to the Spring 2012 pre-redesign course. Lessons learned from teaching the hybrid course, details on the formats' designs, and results from the evaluation will be presented.
"Podcasting in the Statistics Classroom"
Brandon Hanson, Middle Tennessee State University
It is now uncommon to have students in a statistics class who do not have smartphones, and it is becoming more and more common for them to have other handheld devices such as electronic readers and tablets. With this comes the potential for change in the traditional norms of statistics education, including the role of the teacher. In 2010, I created the podcast "Mathematically Hanson" to see if I could take advantage of the capabilities of these new technologies and make myself portable. Since then I have designed over fifty audio and video podcasts for my statistics classes. This poster will demonstrate some the various uses of podcasting, provide tips for creating, promoting, and maintaining podcasts, and discuss the advantages and disadvantages of using this medium in statistics education.
Link to podcast: itunes.apple.com/us/podcast/mathematically-hanson-stat/id44341244
"Teaching Statistics to Nursing Students: An Expert Panel Consensus"
Matthew Hayat, Rutgers, The State University of New Jersey
Patricia Eckardt, Stony Brook University
Melinda Higgins, Emory University
MyoungJun Kim, Mennonite College of Nursing, Illinois State University
Sarah Schmiege, University of Colorado - DenverNursing students are required to take one or more statistics courses. Statistics education is a necessary element of nursing education at all degree levels. This work presents a cohesive summary of an expert panel discussion on Teaching Statistics to Nursing Students held at the 2012 Joint Statistical Meetings. All panelists were statistics experts, had extensive teaching and consulting experience, and held faculty appointments in a US-based nursing college or school. The panel discussed degree-specific curriculum requirements, course content, ensuring nursing students understand the relevance of statistics, approaches to integrating statistics consulting knowledge and experience with classroom instruction, using knowledge from the statistics education research field to make improvements in statistics education for nursing students, and classroom pedagogy and instruction on the use of statistical software. Panelists also discussed the need for evidence to make data-informed decisions about statistics education and training for nurses.
"Mentoring Statistics Teachers to Improve Low-Income and Minority Student Performance in AP Statistics"
Sharon Hessney, Mass Insight Education
The Advanced Placement (AP) Statistics Content Leader of the Massachusetts Mathematics and Science Initiative (MMSI) provides support to 71 teachers in 53 schools who teach more than 1,600 AP Statistics students. Most of these schools have students who are underrepresented in AP Statistics courses. Since high school statistics teachers are typically "sole practitioners" - they are only teacher in their building who has in-depth content knowledge in statistics, this support has resulted in dramatic increases in low-income and minority student enrollment and performance, as measured by the number of AP exam qualifying scores (3, 4, and 5).
A partnership of national and local foundations and corporations and the Commonwealth of Massachusetts fund MMSI. Its mission is to increase the success of low-income and minority students in high-needs schools in AP math, science, and English courses. Specifically for AP Statistics, this population has had limited access to statistics classes. Since the program's inception in 2008-2009, the low-income and minority enrollment has increased at 94% and 47% annually, respectively. The qualifying scores have increased at 70% and 67% annually, respectively. As of 2012, MMSI AP Statistics participants account for 49% of the low-income and 32% of the minority students in Massachusetts.
MMSI's success has been due, in part, to having an AP Statistics content leader to mentors teachers, visits classes, lead professional development workshops, teach Saturday Study Sessions, and provide content and pedagogical assistance and resources.
The AP Statistics Content Leader is an effective model to provide support to high school statistics teachers to increase student participation and performance.
"When Will We Ever Use This? Real-world Statistics Examples"
Krista Holstein, North Carolina State University
Karen Allen Keene, North Carolina State University
Richelle Dietz, North Carolina State University
William Hall, North Carolina State UniversityMINDSET (Mathematics INstruction using Decision Science and Engineering Tools) is a multiyear project involving collaboration among educators, engineers, and mathematicians at three universities in two states. Partnering with high school teachers, the MINDSET project team has created a groundbreaking new curriculum to teach mathematics concepts to fourth-year high school students using mathematical-based decision-making tools from the fields of Industrial Engineering (IE) and Operations Research (OR). The curriculum is presented to students as a series of real-world problem contexts with the purpose of making the underlying mathematics more relevant to them.
Problem contexts and IE/OR tools from the first half of the curriculum (algebra-based) include linear programming, integer programming, the critical path method, facility location problems, and multi-criterion decision-making. Problem contexts from the second half (probability-based) include randomness in industry, quality control, probability distributions, and decision trees. In this poster session, we will provide three examples from the second half of the curriculum.
First, we will provide an example for the Geometric Distribution in the context of the NASA space shuttle missions. In this problem context, students calculate the probability that the first catastrophic failure occurs on any specific flight. NASA and the astronauts all recognize and accept the fact that all manned space flight is inherently dangerous. As work began on development of the space shuttle, the NASA team of engineers and managers collectively estimated that there was a 1-in-80 chance of a catastrophic failure. Within this context, students explore the probability distribution formula for the Geometric Distribution, the cumulative distribution formula, and the expected value formula. They analyze and interpret the process and the results throughout the example.
Second, we will provide an example for the Poisson distribution in the context of a CSI team. The CSI team is composed of three investigators who work together to analyze major crime scenes that occur in their jurisdiction. The county sheriff's department averages three major crime scene calls per day. On average, the CSI team can investigate three crime scene calls per day, each of which averages 2.5 hours. Thus, the daily average workload matches the unit's average capability. The members of the CSI team are always on call and are available to respond to three calls a day (i.e., 7.5 hours), five days a week. They are paid a salary based on a pay rate of $32 per hour. Even if there are not three calls on a given day, the investigators still earn a full day's pay. If the CSI team receives more than three calls on a given day, they are paid overtime at time-and-a-half their usual pay rate, or $48 per hour. The Chief Deputy needs to determine if he needs to hire a new investigator for the CSI team. To make this decision, the Chief Deputy makes use of the Poisson distribution. Within this context, students explore the formula for the probability distribution formula for the Poisson distribution, the cumulative distribution formula, and the cost of overtime versus the cost of hiring a new worker. Again, students analyze and interpret the process and the results throughout the example.
In the third example, students explore the Normal Distribution in the context of quality control. An airplane is an excellent example of where quality control is crucial to the manufacturing and assembly of parts. Students model the assembly of airplane fuselages (the part of the plane where the passengers sit) under optimal and under typical conditions. They use quality control techniques to determine if the assembly process ever becomes out of statistical control; then, they discuss the ramifications of a process that has become out of statistical control.
The poster will provide an overview of the MINDSET project and these three examples. In addition, visitors to our poster will learn about the MINDSET project and will receive handouts for the three examples. These handouts will include the problem context and several questions for students to answer. Visitors will also receive information about the curriculum and where additional resources can be found.
"Infographics: A First-Year Seminar on Visual Communication"
Debra Hydorn, University of Mary Washington
Preparing graphical displays is one of the first steps we follow when analyzing data, yet our students may not know which graphs are appropriate for a given data set let alone how to interpret what they see in the graphs they produce. In this first year seminar students build core skills for visual analysis and learn about the cognitive, communication and aesthetic principles of information design. By examining collections of example infographics students develop an understanding of the components of effective infographics and construct a definition of visual literacy. They learn that effective visual communication relies on the visual literacy skills of both the producer of the graphic and the intended audience. They also learn about the "Curse of Knowledge" and its implication in preparing effective infographics. Class activities include "deconstructing" infographics to develop students' visual literacy skills. To demonstrate their mastery of reading and interpreting infographics students take turns presenting an "Infographic of the Day" to the class. To develop their skills in preparing infographics students learn to use a variety of infographics tools, such as Vidi, Many Eyes, Tableau, Infogram and R. Working in small groups, students prepare infographics for data from a variety of sources, including a survey of students in other first-year seminars across campus and class data of VARK (Visual, Aural, Reading/Writing and Kinesthetic) learning styles. The infographics they produce are posted on a class blog along with student comments about class activities and topics. At the end of the course students prepare a response statement to our course motto: "If information is power, then infographics are the power tools." In addition to providing examples of student work from throughout the course a collection of good infographics resources will be provided.
"A Practice Based Model for Teaching an Introductory Biostatistics Course that Focuses on the Needs of All Learners"
Andrada Ivanescu, East Carolina University
Jason S. Brinkley, East Carolina University
Suzanne Hudson, East Carolina UniversityAs traditional universities see increased competition from online universities, there is growing pressure on academic faculty to provide online content in a meaningful way. Many units in the health sciences are going to online only degree programs and there is a need to deliver introductory biostatistics courses to students whose physical location is far away. This paper will present a model of introductory statistics and biostatistics course instruction that was developed in the practice based setting that is predicated on giving equal treatment to traditional face-to-face students, self-selecting online students, and distance education students whose physical location may be far from the university. The model follows three central tenants: (1) video recordings of in-class lecture and discussions, (2) online course management software is necessary as a repository for all class materials and external class discussions, and (3) equal treatment of assignments via online course management and equal testing settings via instructor approved proctors for non-traditional students. We present empirical results about our video capture and assessment components for our undergraduate and graduate introductory biostatistics courses for our face-to-face and distance education students. We also discuss how our framework can accommodate other types of teaching designs (e.g., hybrid, HyFlex, flipped) and present additional components that can be incorporated to form an extended framework.
"Providing Scaffolding for the P-value Throughout a Traditional Introductory Statistics Course"
Todd Iverson, Saint Mary's University of Minnesota
In a traditional normal-theory based introductory statistics course, concepts related to hypothesis tests are not encountered until late in the course. This poster illustrates the author's attempts to provide scaffolding for the p-value and level of significance throughout the course. The p-value is introduced very early in the course by using it to answer questions about whether or not an observation is unusual. The only requirement at this early stage is an understanding of a dot plot. The question of unusual observations is visited again after the introduction of the normal distribution, and yet again with sampling distributions. Although the author is only using this technique for the second time, anecdotal evidence suggests that this approach eases the cognitive load when introducing the hypotheses test later in the course.
"Everyone Wants to PASS Statistics: Peer Facilitated Study Groups"
Stephanie Jones, Ohio Dominican University
Is there ever enough class time to do all the activities you want to do, to say everything you want to say, and to answer all the questions your students have? Would your students benefit from more time on task and more time to discuss statistical concepts?
PASS (Peer Assisted Study Sessions) is a study group led by a faculty selected peer facilitator. Modeled on the Supplemental Instruction program, PASS is designed to enhance student success in any difficult course.
PASS is not a remedial program for struggling students. PASS targets an entire class with students of all ability levels. Participation is voluntary, and faculty encouragement drives student involvement.
What do students do at a PASS session for a statistics class? They talk about and do statistics! They solve problems, discuss concepts, ask questions, and integrate class notes with readings. Weaker students get more practice with the basics, while stronger students delve deeper and explain concepts to others. Be honest: Did you really understand a p-value until you explained it to someone else?
PASS is not about re-teaching material; it's about processing and understanding through collaboration.
How do students benefit? They become more engaged with the course, and they gain confidence in their statistical knowledge and abilities. Students deepen their understanding and can better focus on the big picture. Sure enough, students who attend PASS consistently often earn a higher course grade than their non-attending peers.
In addition to background information and benefits, this poster will address the ways that PASS differs from tutoring, how to implement PASS at your university (scheduling, facilitator selection and training, program promotion, and more), effective activities for statistics PASS sessions, and facilitation tips and techniques.
"Can Changing the Task Format Help Improve Females' Performance?"
Nadia Martin, University of Waterloo
Jonathan Fugelsang, University of Waterloo
Derek Koehler, University of WaterlooIn examining performance differences in statistical reasoning, gender differences and the effect of experience or training have emerged as two key factors. Surprisingly, though, the combined effects of these two variables have not been studied. In this experiment, the gap in understanding the joint effect of gender and experience on statistical reasoning was addressed using a categorization paradigm, where participants were asked to group 24 problems based on how they should be solved. Specifically, problem representations - as inferred by the reliance on surface versus structural features to guide their classifications - were explored to help shed light on the root causes of conceptual understanding differences in statistics. When the task did not specify the number of categories to create (i.e., unconstrained format), two courses in statistics were necessary to create a significant difference in the quality of mental representations of statistical concepts, as captured by the level of sophistication of the rationales provided with each category created. More importantly, it was demonstrated how using a constrained task - one that specifies the number of category to create - particularly benefits women. With the constrained task format, the quality of reasoning of females improved significantly, where that of men was equal across tasks. Practical implications of these findings are discussed.
"Clarifying the Relationship Between Confidence Interval Overlap and Statistical Significance with an Interactive Game"
Justin C. Mary, Claremont Graduate University
Dale Berger, Claremont Graduate University
Christopher Pentoney, Claremont Graduate University
Michael Toma, Claremont Graduate UniversityBoth students and professionals alike often misinterpret confidence intervals. A common misinterpretation is that any overlap among two 95% CIs reflects a non-significant difference between means (Belia, Fidler, Williams, & Cummings, 2005). This misinterpretation has been termed the "overlap fallacy" because two 95% CIs to can overlap to a great extent before the p value associated with a two-tailed independent sample t test is larger than .05.
Despite the widespread misinterpretations of CIs, few educational software developers have addressed the issue. To aid learners in clarifying the relationship between CI overlap and statistical significance, a Java Applet (Mary, Berger, Saw, & Sosa, 2011) was redesigned to provide a more motivational, interactive, and game-like environment for the user (See Appendix for a visual depiction of the redesigned applet). The redesigned applet affords learners the opportunity to estimate the amount of overlap between either 95% CIs or standard error bars corresponding to given p values for an independent samples t test. Two bars representing sample means are presented, along with corresponding 95% CIs or standard error bars. On each of five trials, the user is given a different target p value and is prompted to adjust the height of one mean until the amount of overlap between the intervals corresponds to the given p value (e.g., p =.05). The user then clicks and drags the mean bar up/down until the desired level of overlap is achieved. After each trial, the user is given two forms of feedback: 1) the correct position of the interval is displayed next to the estimated position, and 2) a score is displayed from 1 to10 reflecting the accuracy of the estimate. At the end of a session of five trials, the user is given a total score, and a motivational picture or short video clip is presented along with a message to encourage the user to improve their score. Total scores are tracked across sessions so the user can monitor their progress.
Several features of the redesigned applet afford the user a motivational and game-like environment. First, the user has control over the type of interval, either 95% CIs, or standard error bars. These options reflect current recommendations for the provision of confidence intervals. Second, users are given immediate feedback concerning the accuracy of their estimate so that any potential misconceptions can be addressed. This functionality provides users with a basic rubric from which to judge their performance. Third, the redesigned applet incorporates a motivational component that was absent from previous versions. The provision of motivational phrases, pictures, and videos may serve to encourage the user to further improve their performance.
The confidence interval game was tested using a sample of graduate students and mTurk workers (N = 25). At the beginning of the study, participants were given a primer including the calculations and interpretation of CIs. Immediately following the primer, a pretest was administered in which participants were prompted to estimate p values associated with varying degrees of CI overlap. Participants then interacted with the CI game for three sessions. Following the CI game, a posttest was administered in which participants were again prompted to estimate p values based upon varying degrees CI overlap. Participants p value estimates for p = .05 were significantly more accurate on the posttest compared to the pretest (z = 2.05, p = .04). Further, of those participants who provided a specific opinion of the game, nearly 90% rated their experience with the CI game as enjoyable or very enjoyable.
The interactive applet is freely available on the Internet at wise.cgu.edu/ci_game and will be demonstrated at the conference; attendees will be able to manipulate the applet.
Features of the Confidence Interval Applet
The user is presented with a bar chart representing two means, along with corresponding CIs or SE bars (Region A). The orange bar can be dynamically manipulated up/down to produce varying levels of CI overlap. The user's task is to set the amount of overlap between two 95% CIs (or standard error bars) to correspond to a given p-value (Region B). All p-values result from a two-tailed independent samples t-test (n = 200). The user can select 95% CIs or SE bars for the display by clicking the appropriate radio button (Region C). After each trial a score is given reflecting the accuracy of the estimate (Region D). At the end of five trials, a final score is presented followed by a motivational picture or video. A perfect score is rewarded with a special picture.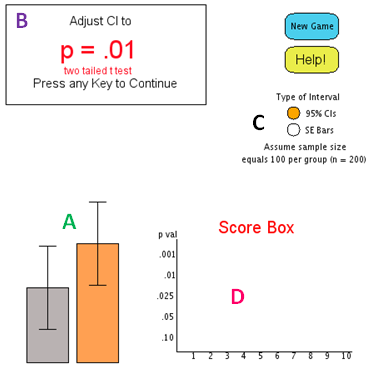
"Assessing the Effectiveness of Mnemonics in Introductory Statistics for Students with Learning Disabilities: Results from a Pilot Study"
Megan Mocko, University of Florida
Lawrence M. Lesser, The University of Texas at El Paso
Melissa Crow, University of FloridaThere are many challenges teaching introductory statistics to students with learning disabilities as discussed in the April 10, 2012 CAUSE webinar (causeweb.org/webinar/teaching/2012-04).
Sometimes the students find just remembering the symbols and definitions challenging, other times the students become anxious at having to remember many concepts. Memory aids may offer a panacea for these challenges. There are no known existing studies that have investigated the effectiveness of mnemonics in statistics. In the pilot, students complete an end of the semester survey on memory aids as well as a series of assessments to judge their potential understanding of memory aids. During two class periods the students were given a pretest on statistical concepts, a review sheet to study, a memory cleansing activity and finally a post test on the same statistical concepts. The students randomly received either a review sheet with memory aids or a review sheet without memory aids. To create this intervention, statistics mnemonics were drawn from recently published collections (e.g. Hunt, 2010; Lesser, 2011). This poster will share some of the preliminary results from this pilot study.
"Making Statistics Meaningful and Real"
Nyaradzo Mvududu, Seattle Pacific University
Over the past few years, reform in statistics education has moved from a focus on procedure to a focus on statistical understanding. Cobb (2007) stated that "our curriculum is needlessly complicated because we put the normal distribution as an approximate sampling distribution for the mean, at the center of our curriculum, instead of putting the core logic of inference at the center." He advocated a randomization-based approach to teaching statistics. Taking their cue from Cobb, a number of statistics educators have proposed just such approaches in teaching statistics, (e.g. CATALST group of the University of Minneapolis; Lock5 group; Rossman, Chance, Holcomb & Cobb).
There are several elements that these approaches have in common. Each of them is consistent with GAISE. They all encourage thinking differently about both pedagogy and content. They are designed to foster statistical thinking by focusing on the logic of inference rather than data analysis. The goal of using such approaches is to help students develop fundamental ways of thinking and reasoning on which to build other skills of data analysis.
I recently taught a course using the CATALST method in the spring 2012.
CATALST stands for Change Agents for the Teaching And Learning of Statistics. In this approach students are asked to model real world problems and simulate data production using the model. Based on the simulation results students can draw conclusions and answer a research question. The critical aspect of this approach is to carefully design problems so that students are immersed in statistical thinking. The teacher acts as a facilitator while the students engage in problem-solving and modeling. A typical unit will begin with an MEA (Model Eliciting Activity). This is an authentic, real-world, open-ended problem that requires students to create and test models (Lesh, Hoover, Hole, Kelly, & Post, 2000). Students are assigned readings that provide the context for the MEA. These readings can be completed outside class. The activity itself may take about an hour to complete. The MEA sets the stage for specific statistical concepts that the instructor wants students to learn. Following the MEA students are presented with a research question that is based on published studies. It is important that the studies are "real" to help students appreciate the use of statistics in real life. An example of such a question is "Is swimming with dolphins therapeutic for patients suffering from clinical depression?" This is based on an article by Antonioli and Reveley (2005). The students create a model as a tool for generating data, evaluating the provided data and answering the research question.
By gathering some preliminary data I was able to conduct some exploratory analysis to assess the efficacy of this course in developing statistical literacy. Specifically, the understanding of p-values was assessed. To investigate students' understanding of and reasoning about p-values, I administered a 6-item test instrument comprised of a subset of questions from the Comprehensive Assessment of Statistics (CAOS) (delMas, Garfield, Ooms & Chance, 2007) and the Reasoning about P-values and Statistical Significance (RPASS-8) scales (Lane-Getaz, 2007).
The CAOS was created as an examination that could be used across various disciplines to evaluate statistical literacy. The development of CAOS involved a rigorous validation process resulting in 57 multiple choice items. The reliability coefficient was .82 which is considered adequate (Nunnally & Bernstein, 1994) and the content validity yielded a 94% agreement among selected experts.
The RPASS instrument was designed to "support research on students' conceptual understanding and misunderstanding of statistical significance" (Lane-Getaz 2007, p.1). It is designed to assess (1) statistical literacy - e.g. recognition of definitions, symbols, graphical representations of p-values; (2) statistical reasoning - e.g. interpreting results, making connections between concepts related to p-values and significance; and (3) statistical thinking - e.g. items requiring students to connect significant results to the broader context of an investigation. The RPASS instrument focuses on the following content areas as they relate to reasoning about p-values and statistical significance: (1) basic literacy, (2) relationship between concepts, (3) logic of inference, and (4) belief in truth or falsity of hypotheses.
The test instrument used in this study used items that specifically addressed an understanding of p-values. The same test was used in a previous autumn with a class taught using a traditional (topic-based) introduction to statistics instructional approach. Group performances on the 6 questions included in the test were compared. For each question the following analyses were conducted:
- A z test comparing the proportion of correct responses to the proportion of correct responses that would be produced by guessing (chance)
- A Χ² test comparing the distribution of correct and incorrect responses of the spring group to the corresponding distribution of the autumn group.
Although nothing conclusive can be declared based on these results due to their preliminary nature, on 3 of the 6 questions there was a significant difference in performance between the two groups. In each of these three instances the spring group outperformed the autumn group. At the very least, the data suggest that the CATALST approach is no worse than the 'traditional' approach in helping students understand p-values. In fact, it could potentially facilitate such understanding.
"A Change in Perspective: Creating Asynchronous Classroom Equivalents"
Joseph Nolan, Northern Kentucky University
Perhaps the single biggest challenge faced by those who teach an entirely online course is the creation of an asynchronous "classroom equivalent" that enables those involved in the class to connect with one another and with the instructor in ways that promote increased understanding of the course material. In recent years at NKU, one of my primary responsibilities has been to conduct an online statistics course for students seeking their masters in nursing. This poster will reflect on the "classroom equivalent" components of that course - discussion boards and surveys - which I have used with reasonable success for student counts ranging from 35 to 65 over the past two years. Aspects such as organization, learning outcomes, time commitments (from both instructor and student perspectives), and grade impact will be considered. I'll share student reflections on the use of these tools and how I have adapted my strategies based on their comments. Visions for appropriate adjustment to a similar online statistical literacy course at the undergraduate level will be considered; and proposed adaptations of online elements to supplement the more traditional face-to-face course will be shared. Conference participants will be encouraged to reflect upon and share their own experiences in development of online educational tools.
"What is the Best Way to Introduce Inference?"
William Notz, The Ohio State University
There are a variety of approaches for introducing inference in introductory statistics books. One is to start with inference for means of normal populations with known variance. Another is to discuss inference for a single population proportion. A related approach is to begin with inference for categorical data. Some recent textbooks begin with simulations and resampling methods. And one could treat inference entirely from a Bayesian perspective. Which is best?
This is not a new issue, but it resurfaced in early January 2013 in series of email exchanges between members of the ASA Section on Statistical Education. Recent textbooks introducing inference in novel ways make it worthwhile to revisit this question. In this poster I will summarize each approach, provide examples of textbooks that use the approach, and consider the advantages and disadvantages of each. I will also provide references to papers that have discussed this issue in the past and suggest an answer to the question "what is the best way to introduce inference?"
"Identifying Developmental Levels and Learning Trajectories in Statistics for Grade 6-12 Students"
Rini Oktavia, Texas State University
M. Alejandra Sorto, Texas State UniversityThe reform movement in school mathematics curriculum since the early 80's suggests the increase in content and rigor of statistics. Two important curriculum documents, the Guidelines for Assessment and Instruction in Statistics Education (GAISE) Report: A Pre-K-12 Curriculum Framework (Franklin, et al., 2007) and the Common Core State Standards in Mathematics (CCSS-M) (National Governors Association Center for Best Practices, Council of Chief State School Officers, 2010) actualize the reform by providing detailed descriptions of what students should know and should be able to do in statistics. These descriptions are, to some extent, based on the hypotheses of learning trajectories of statistical concepts. Testing these learning trajectories empirically will help us better understand the learning development and growth of statistical concepts, particularly those that are related to the investigation cycle in statistics (formulate questions, collect data, analyze data, and interpret results). This study aims to contribute to the understanding of how students learn statistics by describing the developmental growth of students' understanding of statistical concepts and learning trajectories of several concepts in statistics. To reach this goal, an instrument to measure students' developmental levels in learning statistics and learning trajectories of several statistical concepts has been developed. A result of the pilot study and the preliminary result of the actual administration of the instrument to about 800 middle school students will be discussed. Preliminary analysis of the data suggest that the instrument is differencing developmental levels suggesting learning trajectories for some statistical concepts. Further examination of the performance items associated with the expectation of interpreting results based on data represented in various representations is the most difficult. It was also found that students did not perform well on items that assess their understanding about the difference between theoretical and empirical probabilities.
"Teaching and Learning Statistics through Large Scale National Datasets"
Michele A. Parker, University of North Carolina - Wilmington
This poster presentation will convey information about using national data bases to teach statistics to Ed.D. students at UNC Wilmington. The poster includes a description of the course and instructional methods. Excerpts from student's projects and critical reflection essays highlight the benefits of using this approach to teach statistics.
Description of the Course
The course develops school leaders' knowledge and skills in conducting quantitative investigations; and analyzing, interpreting, and reporting research results. In the doctoral course students develop knowledge and skills in descriptive and inferential statistics; using statistical software to analyze quantitative data; and interpreting and presenting quantitative results. Instructional materials for the course were developed using a model for an Applied Data Analysis course, funded by the National Science Foundation (NSF), successfully implemented at Wesleyan University.Pedagogy
Weekly lessons involve lecture, software demonstrations, discussing appropriate resources, and allowing students to use SPSS in class. Each week the students completed a "Practice Exercise" related to the topic covered in class. Students used their dataset to complete the activity. For instance, one week, students learned about descriptive analyses and they submitted an assignment that required them to run frequencies on their variables. Another week the students learned to create graphs and they had a graphing assignment. Students received feedback on the "Practice" activities, which they expanded upon in their "Research Plan/Paper." Students were asked to critically reflect on the experience in order to actively engage them in learning [course outcomes]. Students submitted two critical reflection essays at different points during the semester. In summary, the research project required students to apply knowledge and skills they learned earlier in the course to a "real word" context that is meaningful to them, in order to deepen their learning.Implementation
At the beginning of the course students were introduced to quantitative research through a series of readings. Then students received information about their research project, which required using a national database to conduct a quantitative investigation. Students identified a topic and a corresponding dataset from this list:- ECLS-K (Early Childhood Longitudinal Study
- ELS (Education Longitudinal Study of 2002)
- HSLS (High School Longitudinal Study of 2009)
- NELS (National Education Longitudinal Study of 1988)
- NHES (National Household Education Survey)
- SASS (Schools and Staffing and Teacher Follow-up Surveys)
Students collected articles on their topic and wrote an introduction and brief literature review, which informed their research questions. Next the students identified specific variables, downloaded the data and created a personalized codebook. Students performed exploratory data analysis via frequencies and graphing. They also decided how to manage their dataset (e.g., subset the sample, aggregate variables). Once completed students wrote a "methods" section. They submitted their Introduction, Literature Review, and Method sections as their "Research Plan." Upon approval the students proceeded with the statistical analyses for their project, reported results, and discussed their findings in relation to the extant literature. Students added the "Results" and "Discussion" sections to their "Research Plan" to complete the "Research Paper." At the end of the semester students presented their research to peers and to other faculty/staff who participate in a virtual research conference.
Highlights
The poster will highlight activities that students enjoyed most such as exploring the data and analyzing inferential statistics. Examples of the practice exercises and how they relate to the final project will be used to demonstrate student's learning of statistics."Flipping Out for Statistics: How I Inverted My Statistics Class"
Susan Perkins, Northwest Nazarene University
Technology and teaching innovations open new doors of possibilities for approaches to teaching statistics, but stepping through those doors can be daunting. Student feedback on the difficulty of mastering statistics information and on student need for more guidance on homework assignments in my statistics course, combined with personal desire to make the class a positive, engaging experience for students led me to flip my statistics class. In a flipped (or inverted) class, the content learning happens outside of class and class time is spent on activities designed to reinforce learning. In this poster, I will describe how I created videos to teach class content. I will outline how we spent class time by describing class assignments and projects. A comparison and contrast of my own experience in class and of student feedback demonstrates the effectiveness of this approach. I will also include information about statistics and technological resources for flipping a class. USCOTS attendees will learn reasons for flipping a class, logistics of technology that worked (and did not work) for creating class materials, and guidelines for using class time effectively.
"Using Fun in the Statistics Classroom: An Exploratory Study of Hesitations and Motivations of USCOTS 2011 Attendees"
Michael Posner, Villanova University
Patricia Erickson, Taylor University
Robert H. Carver, Stonehill College
Shu-Min Liao, Amherst College
Nadia Martin, University of WaterlooParticipants at the 4th USCOTS meeting in 2011 were surveyed on their use (or openness to use) of fun in their statistics teaching. The survey asked for background information, respondents' experience using four common modalities of fun, and motivations and hesitations that might affect the use of fun in their teaching. Results were collected from N = 249 USCOTS participants and follow-up qualitative interviews were conducted with 16 who were surveyed. Findings include that many instructors are either using or are open to the use of fun in the statistics classroom, but there are hesitations concerning the availability (or awareness) of resources of fun items. Attendees at this 2013 USCOTS poster will have the opportunity to learn about the resources of the CAUSEweb collection of fun items as well as nominate favorite modality items and brainstorm or list suggest ways of alleviating their (or their colleagues') hesitations.
"The Pepsi Challenge in the Statistics Classroom"
John Rasp, Stetson University
Can people really tell Coke from Pepsi, in a blind taste test? Statistics educators have long discussed the need to actively involve students in learning. I present one such classroom activity, that is interesting to students and which helps teach important concepts in experimental design and data analysis (on a single proportion).
In a "triangle taste test," subjects are presented with three unmarked samples, two of one product and one of another (say, two Cokes and a Pepsi, or vice versa), and asked to identify which one is different from the other two. Note that no familiarity with the products is needed - the question is not whether you can identify Coke/Pepsi, but whether you can even distinguish them.
In its most basic form, the activity can take as little as ten or fifteen minutes in class (if the simple set-up is done ahead of time). I will demonstrate the activity (and USCOTS participants will get the opportunity to take part) and offer suggestions on managing it most efficiently. I will also provide ideas and supplemental materials that instructors might use to expand the activity into coverage of a variety of topics, including the importance of randomization, principles of experimental design, implications for market research and business practice, and analysis of subsidiary research questions. (Are people who are confident of their ability to tell Coke from Pepsi more able to actually do so, than those who are not confident? Are people who regularly consume the product better able to distinguish?)
By the way: in a typical classroom, I have found that the vast majority of students claim to be able to tell Coke from Pepsi. But only around twenty percent are actually able to do so.
"Engineering a Statistical Model: An Activity for an Engineering Statistics Course"
Eric Reyes, Rose-Hulman Institute of Technology
In-class activities can enhance a student's learning and retention of statistical concepts. However, appropriate activities that engage engineering students are less pronounced in the current literature. In contrast to an algebra- based introductory statistics course, engineering students are typically enrolled in a calculus-based course and have a strong mathematics background. We demonstrate an activity suitable for engineering students that investigates the use of hypothesis testing in the context of the linear regression model. The activity builds on material developed in an Introduction to Engineering Science course, a common course in most engineering curricula that focuses on modeling physical systems. In particular, we develop a mathematical model from an engineering perspective for a common tank problem; we then embed this model in a statistical framework (a linear regression model). Students are then asked to collect data and estimate the unknown parameter in the model - the velocity of the water as it enters the tank. This activity highlights the integration of physical and statistical models and the use of statistical methodology to estimate parameters and quantify the variability in those estimates; in addition, the activity aids in bringing the engineering statistics course in line with other courses in the engineering curriculum. This activity requires inexpensive materials and can easily be implemented in small to moderate sized classes with ease. We discuss variations of this activity that are appropriate for an algebra-based introductory statistics course, as well as employing one-sample hypothesis testing or analysis of variance techniques.
"Statistics Education - An Evolving Collaboration: Data, Technology, and Learning"
Kevin Robinson, Millersville University
Justin Kimmel, James Madison UniversityAn evolving collaboration between the presenters spanning over 12 years and focused upon statistical education will be presented. The recent joint endeavors have centered upon the recommendation to "use real data" in statistical education by the Guidelines for Assessment and Instruction in Statistics Education of the American Statistical Association. The guidelines note that using real data sets of interest to students is a good way to engage them in thinking about the data and relevant statistical concepts. Maintaining the interest of the students throughout the course is one of a number of things gained with the utilization of class data surveys. There is now an ownership of the data that is experienced by the students as they look at the data and create and answer questions of interest. The class data benefits students and instructors by being a common context integrated throughout the course. It is used from descriptive statistics, including graphical and numerical statistics for quantitative and categorical data, to questions and analysis of statistical inference. The context of the class survey is also utilized throughout the course in the class examples as well as the assessments including assignments, quizzes and exams. For example, the results of the class survey have worked very well as a context to introduce and explain the difficult concept of independence/dependence. The class survey also provides a context to illustrate the statistical endeavor of construct, collect, calculate and communicate when it comes to data collection and data analysis.
Implementation of the data collection has evolved with technological advances over the years from paper sheets filled out in the classroom to the utilization today of online survey technology such as StatCrunch, Google Docs and SurveyMonkey. The collaboration of the presenters, which started at the same institution, has now evolved to separate institutions, which has added richness to the data collected. Questions of comparison/contrast naturally arise in analyzing the data. The survey questions themselves have continually evolved based upon input of students and current events in the news and world.
The class data survey is not without its limitations, however, mainly because of its passive observational nature. This does afford an opportunity to instruct the students about surveys, observational studies and experimental studies, illustrating the passive and active natures. The class data survey lends itself to questions of inference involving means and proportions as well as simple questions of relationship/association. The class data also has the limitation of being a convenience sample in nature lacking random sampling, and it does not lend itself to more complex experimental designs involving the random assignment of treatments to experimental units. These features of the endeavor again provide a teaching opportunity to illustrate the differences in experimental protocols and resulting limitations in interpretation and conclusions.
The presenters will summarize and share their experiences about this evolving utilization of technology, class surveys and student data. Overall, the endeavor has been very positive for the presenters with various surprises and struggles along the way, which are part of the wonder of working with data and statistical education.
"Changing How We Use Statistical Lexicon: To the HILT"
Neal Rogness, Grand Valley State University
Diane Fisher, University of Louisiana - Lafayette
Jennifer Kaplan, The University of GeorgiaThis poster will interactively engage teachers of introductory statistics about ways in which small changes in how we teach might result in greater understandings on the part of our students. In particular, we seek to engage instructors in finding solutions that are effective in addressing issues in student understanding in statistics that are due to conflicts between statistical and colloquial language or lexical ambiguity. These solutions should not require a large investment of class time in an already over-packed semester; in other words, they should align with the acronym of HILT (High-Impact, Little-Time). This poster would fit well with the theme for USCOTS 2013 of "Making Change Happen."
The session proposers have been actively researching the role that language, specifically the use of ambiguous words such as average, error, normal, random, and spread, plays in teaching introductory statistics. One of the researchers conducted a pre-test, post-test design in her introductory statistics course in which students were asked to provide data at both the beginning and end of the semester about their understanding of the word random, both in its everyday and statistical usage. The course included an intervention in which graphical images were used to exploit the difference between the colloquial meaning of random (weird, out of the ordinary, haphazard) and the statistical meaning (where choices or outcomes are based on probability). The images were of three people dressed in rainbow-striped zebra costumes on a street in Shanghai and of an upside down hat for the colloquial and statistical meanings of random, respectively. The "Zebra-Hat" image was referred to every time the word random was used in class to emphasize the way in which the word was being applied. The graphic metaphor used little additional class time and showed promise in that 40% of her students included the idea of probability in their statistical definition of random at the end of the semester. This is in contrast to a prior semester in which the "Zebra-Hat" intervention was not used and only 8% of the students included the idea of probability in their statistical definition of random at the end of the semester.
The poster will include a brief overview of the applicable research and some of our key findings, including how our published research results have begun to influence the statistics education research community. We will invite poster visitors to draw a statistical term suspected of possessing lexical ambiguity from a hat. The attendee will be asked to reflect on a possible course intervention that might aid in exploiting the ambiguity and which follows the HILT principle of High-Impact, Little-Time using the "Zebra-Hat" intervention used with the word random as inspiration. The essence of the attendee's intervention will be recorded on a sticky note and added to a log of suggestions. Attendees will also be invited to provide their email addresses so that the collection of suggested interventions can be shared at the end of the conference.
"Learning and Facebook? Using StatCrunch Friend Data to Illustrate the Consequences of a Nonrandom Sample"
Aimee Schwab, University of Nebraska - Lincoln
StatCrunch, an online stats app published by Pearson, includes a feature called StatCrunch Friend Data. Friend Data lets students sign in with their Facebook accounts, and pulls information from their friends' profiles. Undergraduate statistics courses don't spend much time talking about what happens to results with a non-random sample, and the Friend Data activity illustrates that! At the start of the activity, most students don't question the methodology (they're too excited to be on Facebook in class!). After they calculate their own confidence intervals, the students compare theirs to other students. Most immediately notice their intervals are extremely different, and usually very small. They also compare their intervals to published data about Facebook users as a whole. At the end of the activity, students discuss in groups ways to get a better sample from an online changing population - the general consensus is that it's tricky! Before and after the activity students should discuss the randomness assumption - whether it's realistic, how necessary it is, and whether they have ideas to adjust for when it's not met.
This activity keeps students engaged with a data set, gives them practice using a software program to calculate confidence intervals, and links back to earlier sampling and random variability concepts from the course.
"The Probability Distributome Project: Interactive Teaching of Probability Distributions Theory and Applications using Data, Models and Webapps"
Kyle Siegrist, The University of Alabama in Huntsville
Ivo Dinov, University of California - Los Angeles
Dennis Pearl, The Ohio State UniversityThe goal of the Probability Distributome Project is to enhance the teaching and learning of probability modeling by developing new computational and educational resources for exploring, discovering, and interacting with a variety of probability distributions. The project is a collaboration between the University of Alabama in Huntsville, The Ohio State University, and the University of California Los Angeles. The project is supported by grants from the National Science Foundation (NSF CCLI/TUES Grants 1023115, 1022560, and 1022636).
The Distributome infrastructure utilizes modern information, technology, networking, and pedagogical resources to create, validate, and broadly distribute a variety of web-based learning materials. These include an innovative graphical distribution navigator and editor, interactive applets, computational and graphing tools, interactive learning activities, and statistical games. The entire Distributome project is open-source (LGPL) development and open-utilization (CC-BY) by the entire community. All Distributome webapps, learning materials, publications, tutorials, hands-on activities and instructional resources are always openly accessible via the main Distributome server (www.Distributome.org), as well as through various partnerships (e.g., www.MathDL.org).
The Distributome resources are developed by faculty, researchers and scientists, including supervised students, to address their specific needs of improving student motivation, enhancing learning experiences and providing lasting understanding of probability theory and applications.
This presentation will include a live demonstration of the Distributome web apps; a chance to try your hand at a new probability game; and the opportunity to sign up to be part of the Distributome community of probability instructors.
"Statistics for Engineers Class Projects: Capstone or Confusion"
Charles Eugene Smith, North Carolina State University
Kim Weems, North Carolina State University
Renee Moore, North Carolina State UniversityST 370 Statistics for Engineers is structured differently than most other introductory statistics courses, in that the order of topics is reversed. Collection and Analysis of Data, Experimental Design and Factorial Experiments, ANOVA and regression, are covered BEFORE probability, random variables, central limit theorem. One main reason is so that the students can do a two or three factor designed experiment of their choosing as their course project (20% of the final grade). Several mechanisms have been employed to try to encourage success in this endeavor. Three instructors will present some of the things that have worked well and some that have worked less well. Students may do the project alone or in groups of 2 or 3; this creates some additional challenges for the web and distance sections of the course.
"Using Inquiry-Based Team-Taught Environmental Laboratories to Teach Statistics"
Michelle Smith, Eastern Kentucky University
Alice Jones, Eastern Kentucky UniversityWe sought to take advantage of the natural curiosity and interest that young people have about environmental phenomena in our region to increase their performance and success in the introductory statistics courses, and improve student attitudes towards mathematics and statistics in general by using a collaborative team-teaching approach to deliver inquiry based laboratories employing real-world environmental datasets to teach core statistical concepts. We established a partnership between the Department of Mathematics and Statistics and the Eastern Kentucky Environmental Research Institute, and (a) developed an inquiry-based team-taught environmental laboratory for our STA 270 - Applied Statistics I course, (b) developed a general laboratory to serve as a control for the study, and (c) established a professional community of multidisciplinary faculty to inform the curriculum development process, and facilitate dissemination cross campus and to other institutions. The environmental laboratory exercises incorporated local and regional water quality and biological data from the Appalachian Kentucky region collected by the Environmental Research Institute, with the level of inquiry increasing from structured to guided to open as the course progressed.
An applied approach is not in itself a new approach to teaching quantitative methods at the undergraduate level. Many disciplines (economics, psychology, biological and life sciences to name a few) often teach "in-house" statistics or analytical courses that focus on discipline-relevant datasets and analytical techniques. But these courses are typically taught by applied practitioners and not statisticians. What was potentially transformational about our approach is the interdisciplinary collaboration that that pairs a statistics faculty with an applied scientist to teach general introductory statistics laboratories that are not aimed at a specific group of majors, but rather at demonstrating the broad applicability of statistical reasoning to understand real-world problems across disciplines.
Environmental and control laboratories were developed and delivered during the fall and spring semesters of the 2011/2012 and 2012/2013 academic years. The optional laboratories were open to any student co-enrolled in a STA 270 section. Each student self-selected their laboratory or choice of no laboratory. The laboratories were graded as pass/fail based on completion of weekly lab exercises.
The evaluation of effectiveness of the environment-centered, inquiry-based statistics laboratory curriculum at college level was based on the following measurable outcomes. Student assessment on core content was evaluated by comparing performance of students in the Environmental AIMS laboratory class, control laboratory, and no laboratory on selected identical midterm exam questions and on approved general education assessment final exam questions. Student assessment concerning attitude toward mathematics and statistics was determined by comparing the Environmental AIMS laboratory, control laboratory, and no laboratory students pre- and post-test scores administered on Student Attitudes towards Mathematics & Statistics at the beginning and end of the semester.
"Using a Discussion-Based Approach in an Upper Level Statistics Course"
Melissa Sovak, California University of Pennsylvania
Douglas C. Raffle, California University of PennsylvaniaUsing discussions can often be difficult in the world of mathematics and statistics; after all, there really is only one right answer at the end of the day! However, many students are so concerned with getting to this final answer that they fail to be aware of the intricacies of each problem. Due to this issue, students typically fail to develop good problem solving skills in general and also they fail to be able to navigate subtle differences from problem to problem. It is becoming more and more evident that, despite extensive lecturing and presentation of examples, students will often blindly apply methods and formulas that do not fit the situation because they simply do not have adequate practice in solving problems. This presentation focuses on the researcher's experience with a discussion-based advanced undergraduate statistics course. This upper division level course was redesigned to focus each lecture on discussion by presenting a problem, allowing groups of students time to discuss a proper approach and then following up with a discussion and presentation of solution, including notes and theorems. The poster presentation will present evidence of increased student performance versus a traditional lecture-based approach, student feedback towards the class structure, sample discussion questions for a variety of topics including determining probabilities, probability distributions, Markov chains and more along with sample discussion notes produced for specific lectures. Also addressed will be information on how this approach can (and has been!) adapted to other upper level courses.
"Building the Biostatistics Pipeline: Summer Institutes for Training in Biostatistics"
Roslyn Stone, University of Pittsburgh
To address the heightening concerns regarding a pending shortage of biostatisticians, in 2003 the National Heart, Lung, and Blood Institute (NHBLI) requested applications from colleges and universities for Summer Institutes for Training in Biostatistics (SIBS) programs to introduce undergraduates to the field of biostatistics. The charge was to "develop, conduct, and evaluate a summer program in the basic principles and methods of biostatistics to attract new students into the field," specifically undergraduates majoring in mathematics or other quantitative areas. In 2004-2006, programs were funded at Boston University, a partnership of North Carolina State University and Duke Clinical Research Institute (NCSU-DCRI), and the University of Wisconsin-Madison (UW-Madison); these three programs were renewed in 2007-2009. An additional five programs were funded in 2010-2012 at Emory University, the Universities of Iowa, Pittsburgh, and South Florida, and Washington University in St. Louis. A total of 6 SIBS programs have been funded for 2013-2015, at Boston University, Columbia University, NCSU-DCRI, UW-Madison, and the Universities of Iowa and Pittsburgh.
Although each SIBS program is individually conceived and conducted, and exploits the unique opportunities and resources available at the site, all share common elements. All involve interactive training activities designed to introduce a diverse body of undergraduates to the vibrant field of biostatistics and related disciplines (e.g., epidemiology, statistical genetics, health services research). SIBS programs use innovative and creative approaches to teaching, and high-profile, relevant examples, including NHLBI-sponsored studies of heart, lung, blood, and sleep disorders. We describe some of these data resources, and ways that data from various research studies are integrated into the SIBS programs through classroom activities, journal clubs, and individual and group projects. This presentation is based on Sullivan, Davidian, DeStefano, and Stone (Feb. 2013, CHANCE).
"Using Intuitive Test Statistics in a Randomization-Based Introductory Course"
Todd Swanson, Hope College
Jill VanderStoep, Hope CollegeRandomization-based introductions to statistics are gaining momentum. Advocates of this approach hypothesize that it offers students a more intuitive, more direct path to understanding the logic and scope of inference. Recently published assessment data offer preliminary support for this hypothesis, although many questions remain.
One potential advantage of the randomization-based approach is its flexibility. The traditional approach is tied to test statistics and pivotal quantities like z, t, and F that rely on the Central Limit Theorem, and that require an understanding of variance. The randomization-based approach works with a wide variety of summary statistics. Whereas the traditional approach requires that students learn about standardization, t versus z, and perhaps variance ratios while they are still learning the logic and scope of inference, the alternative allows students to work with more intuitive statistics such as the difference in means or difference in medians for comparing two groups. For comparing three or more groups, they can work with the mean absolute pairwise difference of means (or medians), and put off learning about variance ratios until later.
In this poster presentation we will demonstrate the use of a flexible suite of freely available web applets which naturally transition students among a variety of test statistics. We will also describe the decisions we've made about choice of test statistics, the rationale behind those decisions, how these decisions drive how we use technology, and some open questions.
"A Randomization-Based Method for Emphasizing Sampling Distributions and Introducing ANOVA"
Laura Taylor, Elon University
Kirsten Doehler, Elon UniversityThe purpose of this project is to develop a randomization-based method for emphasizing sampling distributions while introducing ANOVA in an introductory-level statistics course. Rossman and Chance (2008, statweb.calpoly.edu/csi) developed a series of randomization based activities for an introductory-level statistics course to introduce topics of inference such as paired-samples hypothesis tests and tests for proportions. They also include an activity for introducing ANOVA. However, an emphasis of their activity is to use Minitab to learn about ANOVA. We introduce a new randomization activity using a data set from Neter et al. (1996, Applied Linear Statistical Models) on the sales of cereal based on four different package designs. Students generate the sampling distribution of the ANOVA F-test statistic by first randomly shuffling index cards that identify each of the sales in the data set and then randomly dealing the cards to a package design using methods similar to Rossman and Chance (2008). Using a pre-designed Excel spreadsheet, students calculate the newly introduced F test statistic and then collaborate to generate the simulated sampling distribution under the null model. This visualization allows students to revisit the idea of sampling distribution. The simulated sampling distribution leads to a natural discussion of the right-skewed shape of the sampling distribution of the F test statistic and makes connections to the definition of a p-value. Most inferences up to this point in the course are based on test statistics with symmetric sampling distributions, which are centered around zero. Pre- and post-tests were administered to students in experimental and control sections of the same course taught by the same instructor. Assessment items include having students define key terms in their own words and applying the ideas of inference to novel situations. Results of these assessments as well as further details behind this class activity are presented.
"Multivariate Data Analysis as an Elective for Undergraduates"
Amy Wagaman, Amherst College
The introductory statistics course has undergone major redesign over the past decade. More recent work towards improving the second course has resulted in textbooks like Kuiper and Sklar's Practicing Statistics: Guided Investigations for the Second Course, and Cannon et al's Stat2: Building Models for a World of Data. It is natural to next consider what topics our elective courses (beyond the first and second course) should cover, and there are many statistical topics that can be covered. We present an applied multivariate data analysis course as an elective course, taught in the Fall of 2009 and in Fall of 2012 (both without a linear algebra pre-requisite). Topics such as clustering, classification, and principal components analysis are relevant for many students, especially those writing theses - whether that is in biology looking for differences between species or in English trying to identify which author likely wrote an anonymous manuscript in the 1800s. In particular, some of these topics are related to aspects of data-mining, which is a "hot" current statistical application area of interest, and students could benefit from introductions to these topics. The course offered an applied introduction to these and other topics, using hands-on data analysis in weekly labs to help students tackle the concepts. The course can be taught at a variety of levels based on student backgrounds (the pre-requisites required). For example, it could be a very applied course with no pre-requisite or an introduction to statistics pre-requisite, or a much more theoretical course for students who have had an introduction to statistics and linear algebra (could add a regression course as well). This poster will share materials and activities from the class that were deemed successful at helping the students learn the material and see the techniques in real applications. Some details about the course structure and end-of-course evaluation comments are provided. The course is formatted in modules for easy adaptability depending on the interests of the instructor and students in the course - remove one module and add a new one, remove one and break one into two parts for more emphasis, change the order of the modules, etc.
"Assessing Readability of College Level Statistics Textbooks: A Quantitative Lexical and Grammatical Analysis"
Amy E. Wagler, The University of Texas at El Paso
Lawrence M. Lesser, The University of Texas at El Paso
Ariel I. González, The University of Texas at El PasoThere is a need for college-level statistics textbooks (or other instructional materials) that are written in a manner that is less intimidating and easier to understand for students, including English language learners (ELL). We selected a representative set of current editions of 18 well-known statistics textbooks (that varied in their incorporation of the College GAISE guidelines: ASA, 2010) to assess the lexical and grammatical complexity of the writing. For a manageable focus, we then chose four topics covered in most textbooks: measures of center, line of fit, regression analysis, and regression inference. The textbook excerpts obtained were coded with a numerical identifier and the researchers were blinded to the author, title, and publisher. The files were then prepared for online lexical software analysis using consistent criteria informed by the research question. Analysis using Coh-Metrix and Compleat Lexical Tutor yielded various lexical indicators, which were then compared for the text excerpts using principal components analysis. Simple lexical features comprised more than 70% of the variability in the readability of the texts and grammatical features of the text are also shown to affect readability. Overall, the lexical and grammatical features of the text were found to vary more by topic than by book. (Attendees will be able to browse a sample of texts in this study that were found to vary in level of readability.) To contextualize such quantitative results, we then began conducting exploratory qualitative semi-structured interviews to see what students (of varying English proficiencies) emphasize when assessing their preference among a set of statistics textbook excerpts. Attendees will be able to engage in informal "peer debriefing" with us by discussing preliminary patterns or conjectures from interview transcripts that we have by the time of USCOTS.
"Statistical Treasure Hunt: An Outdoor Game Activity to Enhance Student Engagement and Motivation"
Dammika L. Walpitage, The University of Tennessee - Knoxville
Niranji Dopa-Pathirage, The University of Tennessee - Knoxville
Ruwan Chamara, Sam Houston State University
Vittorio Marone, The University of Tennessee - Knoxville
Hussein Mohammad, University of Kelaniya
Gayan Dikkumburage-Silva, University of Kelaniya
Thusitha Narasinghe, University of KelaniyaTeachers of statistics face a number of challenges in their effort of motivating and engaging students in the study of abstract statistical concepts. To overcome these difficulties, they look for innovative techniques that facilitate teaching and learning in this discipline. Well-designed educational games can increase student motivation and engagement, presenting challenges that effectively link curricular content to fun activities. Furthermore, outdoor game activities keep students engaged, both mentally and physically, in a social and open-air environment. Therefore, outdoor games with statistical aspects will be helpful to enhance the statistics teaching and learning process.
Our presentation will describe an outdoor game titled "Statistical Treasure Hunt" which was implemented with undergraduate students in statistics at a Sri Lankan university as one of the activities performed during their annual field day. The game was mainly developed as a remedy for the lack of motivation the students had towards a mathematical statistics course which every student in statistics degree program was required to take in the second year. Students competed in teams to find a hidden treasure located in a place that they were unfamiliar with. To advance through the path leading to the treasure, they had to solve a series of statistical problems that featured multiple-choice answers. Each answer (right or wrong) directed students to a specific location, however, only the correct answer led to the location with the clue (represented by another statistical problem) necessary to advance to the treasure. Wrong answers directed students to locations with "warning notes" that informed students that the answer was wrong and that they needed to find the correct answer in order to move forward in their quest for the treasure. Moreover, between locations each team was required to complete additional challenges designed as competitive but fun activities that were designed to increase student enthusiasm and collaboration.
During the game students demonstrated enthusiasm and motivation towards solving statistical problems by sharing what they had learned in the classroom in order to win the treasure for their team. It was observed that the engagement in problem solving activities during the game was higher as compared with classroom activities, mainly due to the competitiveness. After the Statistical Treasure Hunt relatively higher number of students attempted in solving problems given in the classroom and contacted the instructor with their concerns on subject matter, indicating a positive impact of the game on student learning.
The presenters will discuss about the development of the game and share their observations on student motivation and engagement that emerged during the game and in subsequent class activities. Moreover, they will highlight the convenience of implementing this outdoor game in regular class period within the college premises without any significant modification. Furthermore, the presenters will broadly discuss how the game can be modified as an indoor class activity by replacing "warning notes" with fun activities as penalty for students who come up with wrong answers, and providing the next question (instead of sending students between locations) for students who show the correct answer. Therefore, this presentation will be helpful for statistics educators who are willing to experiment strategies for enhancing student learning.
"Using National Health Surveys for Teaching Statistics"
Feifei Wei, University of Arkansas for Medical Sciences
One of the challenges for student projects in statistics courses is the availability of real life data sets for students to simulate an on-job experience. The purpose of this presentation is to offer a teaching experience using national health surveys public use databases for student course projects.
The National Center for Health Statistics (NCHS) at the Center for Disease Control and Preventions is the nation's principal health statistics agency, providing data to identify and address health issues. There are four major data collection programs at NCHS: National Health and Nutrition Examination Survey, National Health Care Surveys, National Health Interview Survey, and National Vital Statistics System. These survey data have been used by policymakers, journalists, and researchers to identify health problems, determine barriers to accessing health care, study health-related disparities, and monitor progress toward national health objectives and well-being indicators.
Any of the above or other national health surveys can be offered to students for a student project in their statistics courses. Students will need to already have taken a basic statistics course before the class and comfortable with one of the statistics program, for example, R, SAS, SPSS. During the course two or more national health surveys and their key components, such as survey population, sampling mechanism, key survey questions, and public use databases, are introduced to the class. Students will, individually or as a group, depending level of the course, then prepare an oral presentation on an additional national health survey and manuscript(s) using the national health survey.
Throughout the course, students will, individually or as a group, again depending level of the course, work on a research project using public use datasets from a national health survey of their choice. Project tasks include identifying research questions; identifying appropriate national health survey; reviewing literature, defining appropriate variables; organizing and analyzing the data; and interpreting and presenting the results. Four check points are built in throughout the semester, the first is for students to turn in a paragraph discussing what they would like to study, which national health survey that they want to use, and why they think that the chosen national health survey will be able to answer their research question. The 2nd to 4th written assignments under course project are drafts leading up to the manuscript consisting of a background and significance, methodology, and result sections in support of their research idea. The background and significance is (i) literature review and (ii) statement of the problem to be addressed by the proposed study. The methods section consists of a description of (i) data source and participants, (ii) key measurements (that is, key survey questions used and how they will be used in analyses), (iii) statistics analysis plan. The results section will consist of analysis results, including tables and/or graphs, in answering the research question. At the end of result section, students will use a paragraph or two to summary their results. Finally, the manuscript is the revised, written combination of the background and significance, methods, and result sections.
The above provides a valuable hand-on experience to students how to use real-life data and statistics that they have learned to conclude a project at work and answer a research question.
"Seat-of-the-Pants Instructional Apps Using RStudio"
Homer White, Georgetown College
The proposed poster is simply a vote of confidence for the R-based approach to teaching statistics, as promoted by Pruim, Horton and Kaplan of Project Mosaic and elaborated by them in a pre-conference Workshop in May 2011.
I have taught an upper-level probability and statistics sequence -- and one small-scale experimental introductory statistics class -- using R in the integrated development environment RStudio, and I have found RStudio very useful for writing small-scale apps and other demonstrations: not the fancy stuff you would publish on the Web, but the sort of thing that a busy instructor writes a few minutes prior to class and that responds very specifically to issues raised in that particular class in that particular semester.
My aim is to point colleagues toward a territory in between avoiding technology on the one hand (sometimes advisable) and borrowing prepared open-source apps on the other hand (often advisable) -- a Middle Way that can be fruitfully occupied by the average instructor who is no computer scientist but who is willing to write a few lines of code.
Examples will include:
- illustration of the Central Limit Theorem
- Graphs of Power for Hypothesis Tests
- Mosteller and Tukey's Ladder of Re-Expression
- simulation routines that illustrate the perils of Data Snooping in inference concerning categorical variables (this is a lead-up to the Chi-Square Goodness of Fit Test)
- and more!
There will be a physical poster, but for the most part people will pick what they want to view from R Scripts on my laptop.
"Changing your Final Project Design to Encourage More Critical Thinking while Avoiding Trouble with your Institution's IRB"
Cathy Whitlock, University of North Carolina - Asheville
Jimin Lee, University of North Carolina - Asheville
Seunggeun Hyun, University of South Carolina UpstateStudents in an introductory statistics class develop critical thinking skills when they have opportunities to...
- Ask questions that interest them
- Gather and organize their own data in an effort to answer these questions
- Determine which statistical test to run and which kinds of charts or graphs to use to display their results
- Communicate their results clearly and then reflect upon the validity of their results
Unfortunately, students like to ask questions that involve surveying human subjects, and this now requires IRB (Institutional Review Board) approval. Every institution's IRB functions somewhat differently, but all are operating under the same federal guidelines. Our poster will provide tips for working with your institution's IRB. We provide a list of questions that instructors might want to ask a member of their IRB before planning a student project involving data collection. We will cover types of survey questions that require HIPPA compliance. We will discuss consent forms, and provide examples of survey questions that are often exempt from the more complicated levels of IRB review.
Cathy has been revamping her student projects to encourage critical thinking and Jimin is on UNCA's IRB. Because Cathy and Jimin ride to school together every day, they have had ample opportunity to explore the intersections of student curiosity and IRB tolerance. Thanks to help from Jimin, Cathy's latest student project involving data collection was formally approved by the IRB.
"GAISE in Discipline-Specific Courses"
Beverly Wood, Indian River State College
A qualitative research project using GAISE College Report as a framework for describing introductory courses designed for students in a specific major. Two social science courses, one for entrance into business majors, and one for a cluster of STEM majors are analyzed by their implementation of the Recommendations for Teaching and emphasis on the Goals for Students endorsed by the American Statistical Association.
While acknowledging the diverse setting, audience, and purpose of introductory courses, existing research assumes that courses offered by different disciplines share the same goals and teaching practices. The purpose of this study is to examine the objectives for student outcomes and pedagogical delivery of introductory statistics courses in various academic departments to provide explicit evidence for this assumption.
Four descriptive case studies are presented through a pattern-matching analysis followed by a cross-case analysis. All four cases demonstrate many of the goals and teaching strategies recommended by GAISE, even though none of the professors had prior knowledge of the guidelines. This study supports the GAISE assumption that its goals for students and recommendations for teaching are broad enough to apply to introductory courses in a variety of disciplines.
"Students in Need of an Attitude Adjustment?"
Jacqueline Wroughton, Northern Kentucky University
April Kerby, Winona State UniversityDisgruntled looks and horrifying stories are the first reactions we usually get when telling others we teach statistics. Due to this fact, one goal of statistics educators is to get students to see the value in learning statistics in the hopes they might gain some appreciation. A lot of work has been done by Candace Schau and Marjorie Bond in measuring students' attitudes towards statistics using the SATS © survey (Schau 2003). This survey helps to measure students' attitudes in six key areas (at both the beginning and end of the semester):
- Affect - students' feelings concerning statistics
- Cognitive Competence - students' attitudes about their intellectual knowledge and skills when applied to statistics
- Value - students' attitudes about the usefulness, relevance, and worth of statistics in personal and professional life
- Difficulty - students' attitudes about the difficulty of statistics as a subject
- Interest - students' level of individual interest in statistics
- Effort - amount of work the student expends to learn statistics
The research presented in this poster looks at one method utilized in an introductory statistics class at Northern Kentucky University and Winona State University in the spring 2013 semester. The authors asked students to answer a "question of the day" at the beginning of each class period. This specific task was chosen due to not only its aim at getting students to think how statistics can be applied to different facets in their lives, but also due to its straightforward implementation in the classroom. An example "question of the day" is given below:
Suppose that we did a blind taste test of two sodas and found statistically significant evidence that soda A was preferred over soda B. What does this mean (and what doesn't it mean)? What should we do now?
The hope is that if students could see the "usefulness" or relate to the material in class, their attitudes towards the subject matter might change for the better. The poster will summarize the data collected and the authors' reactions through mid-semester.
"An Effective Paradigm in Teaching Elementary Statistics with Minimal Use of Formulas and Calculations"
Jesse Yu, College of Saint Elizabeth
Typically, an Elementary Statistics (or an Introduction to Statistics) course offered in a small liberal arts college not only serves as a statistical literacy course in the general education curriculum, but also as an allied requirement for programs such as Justice Studies, Nursing and Sociology etc. Students taking the course have a wide range of mathematical background and skills. I will demonstrate how to use appropriate technology and real life examples to help reduce students' anxiety and fear of mathematics, minimize the calculations students have trouble with and avoid common mistakes students make with minimal use of formulas. While it is impossible to eliminate calculations and formulas from an Elementary Statistics course, it is possible to change the way we teach statistics by using technology and real life examples to reduce the use of formulas and calculations. This paradigm is effective in increasing students' confidence, boosting their performance and reducing their fear, anxiety and math phobia. It focuses on developing students' statistical reasoning skills and making students good "statistical citizens" which are the goals of the Elementary Statistics course.
"Using Mobile Technology in Introductory Statistics Courses"
Aklilu Zeleke, Michigan State University
Pramod Pathak, Michigan State UniversityOver the last few years, mobile technology (such as a smartphone, an IPad or a Tablet) has become indispensable in commerce, industry and service sectors. Recent studies suggest that it has great potential in education. For example, it can be used to deliver educational materials efficiently and thereby enhancing the cognitive processes of student learning. Any mobile device can be used by the students to communicate and interact with their peers and educators in real-time. Mobile technology can also be integrated into curriculum design to improve interactivity in the classroom.
Both students and educators benefit from applications of mobile technology. It allows students to access educational materials, enabling them to learn when the need arises in a timely fashion, no matter where they are -- even when they are on the move. For educators, mobile technology provides a new platform of education delivery and a new level for student-instructor interaction.
While mobile technology has found its application in engineering, medicine and business education, there is a pressing need for its effective use in statistics education. In this work we present a preliminary work of integrating mobile technology in introductory statistics courses at Michigan State University where instructors use it to conduct surveys in the classroom, ask questions to test students' understandings and get live feedback on the course. We present the framework under which the system works as well as examples of classroom demonstrations. A real time demonstration on how this works will be presented. Through this approach we were able to do all that one can achieve with clickers and more; thus, saving students the need to add one more gadget to their list.