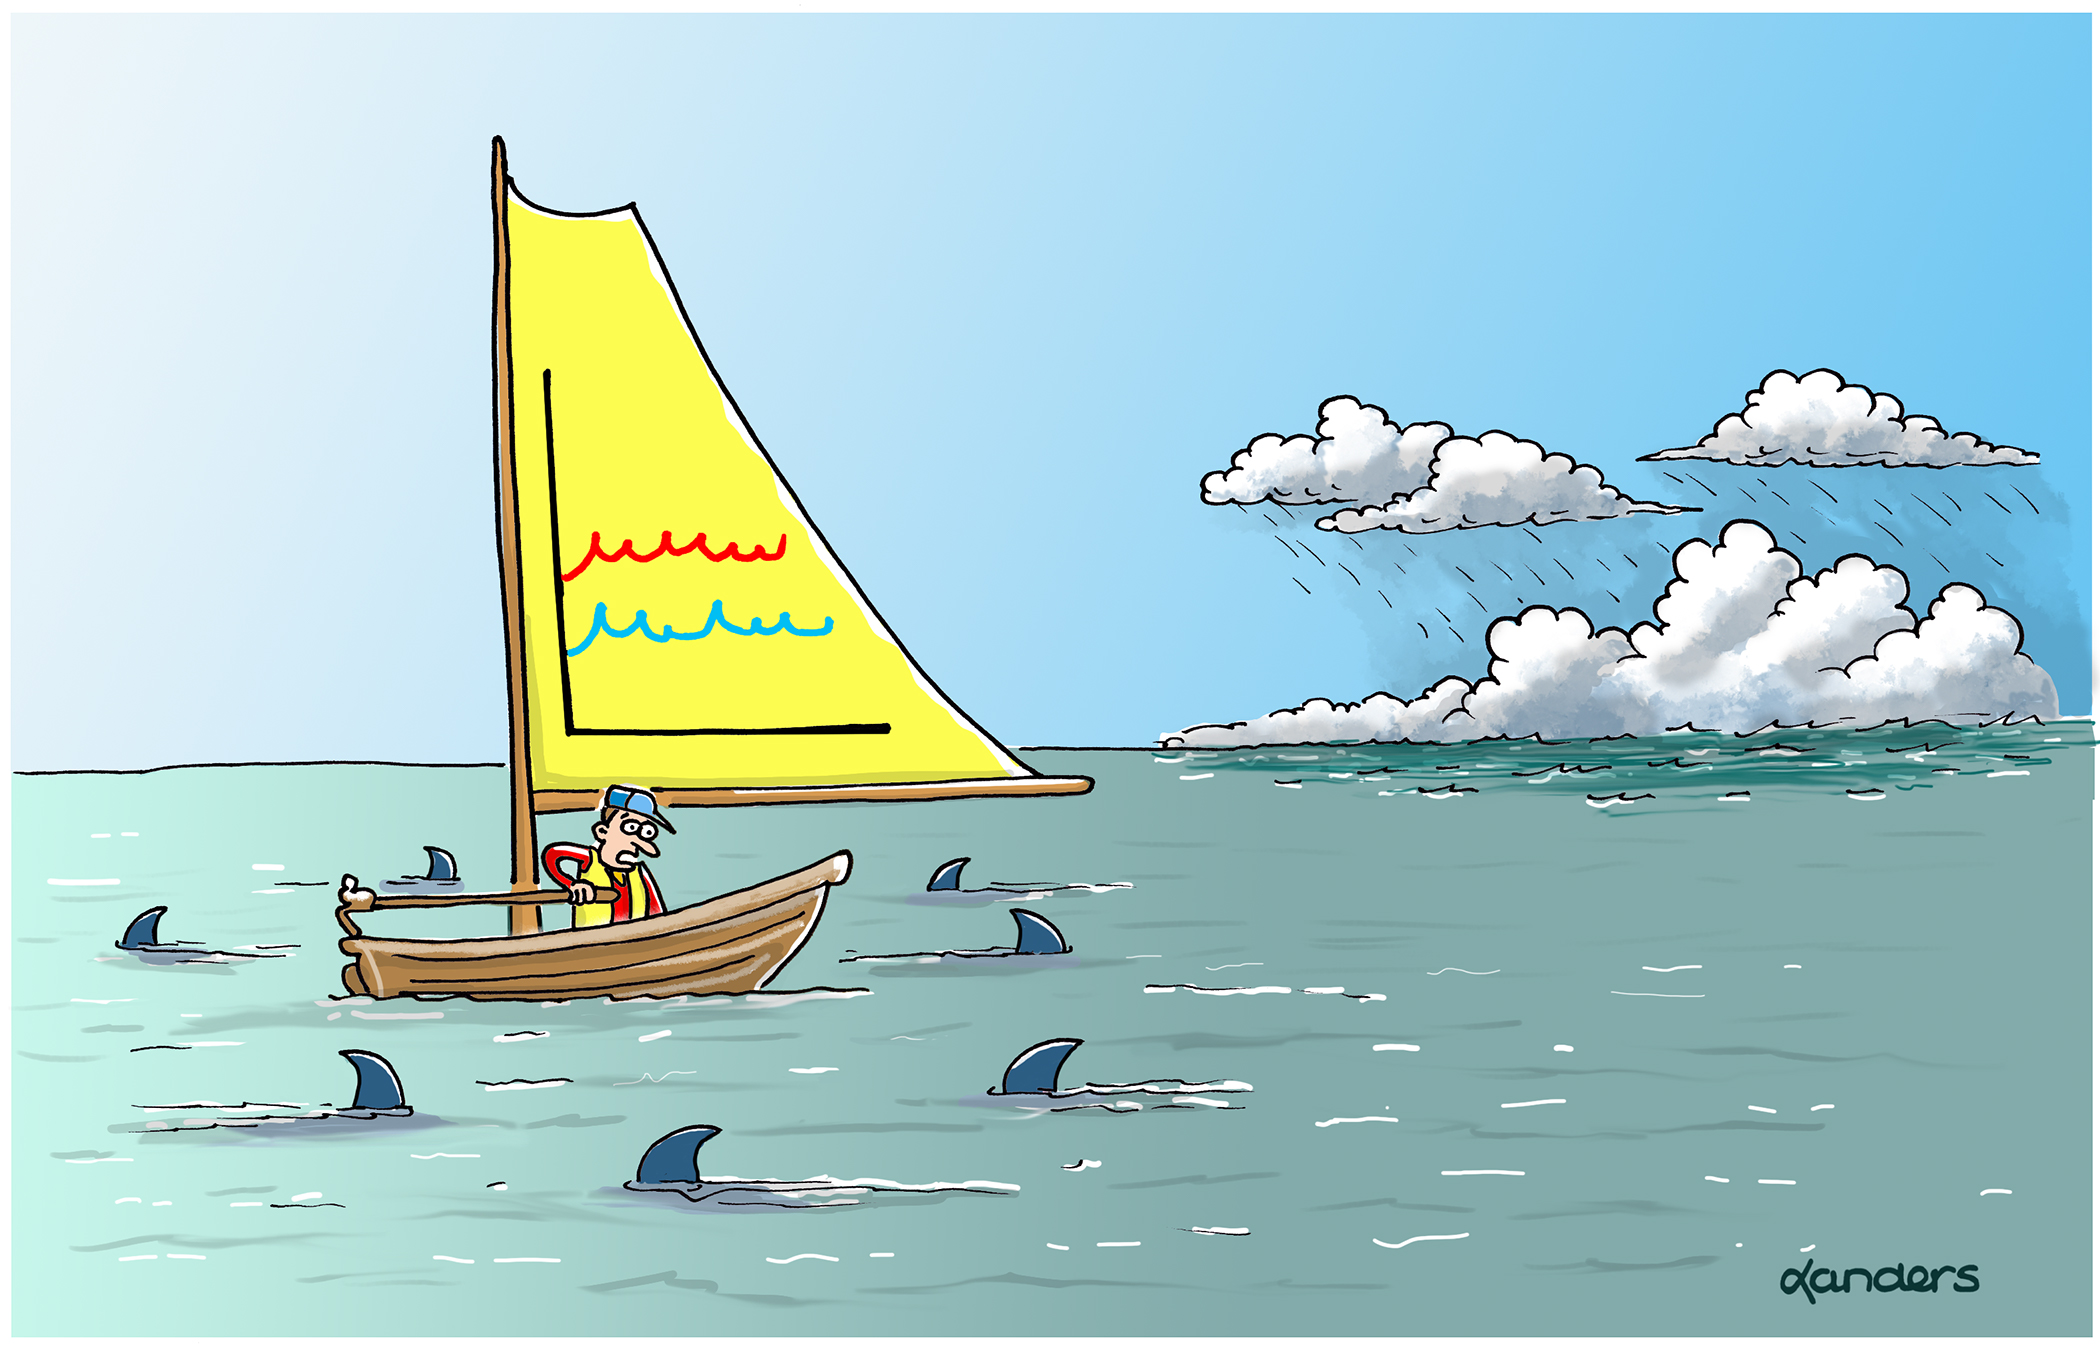
Graphs highlight sail-ient features of the data
The July caption contest featured a person sailing. The sail on the boat shows a design that looks like a comparative time series plot. Meanwhile, there is group of sharks circling the boat and a very menacing storm is seen in the distance.
The winning sign/caption for the June contest was "Graphs highlight sail-ient features of the data," written by Larry Lesser from The University of Texas at El Paso. Larry's caption can be used to highlight various features of the times series plots shown such as the seasonal trends perhaps signaling the oncoming storm in the cartoon.
An honorable mention this month goes to Jim Alloway from EMSQ Associates for the caption: "When analyzing your data, always be on the lookout for unexpected interactions," which can be used by instructors for discussing the idea of possible synergistic effects seen with interacting factors.