Help Me Make a Good Bar Graph
-
Provide the name of a variable that would be appropriate to summarize with a vertical bar graph:
Remember that the distribution of a quantitative variable is given in a histogram. A bar graph is used to display the distribution of a qualitative (categorical) variable.
-
In a bar graph, it is important for the y-axis to begin at .
-
The of the bars in a vertical bar graph should be proportional to the data/counts they represent.
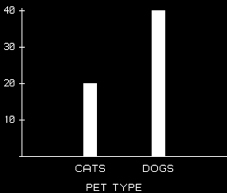
For example, here's a bar graph for numbers of pets for households on a city block; it shows 20 cats and 40 dogs.