Sandbox: Difference between revisions
| Line 12: | Line 12: | ||
In some ways that second number (the total percentage of marriages that are between blacks and whites) is somewhat of a trick question. Still, I’m surprised how far off my intuition was on both these numbers (the rate of approval of interracial marriage in 1958, and the current percentage of marriages that are between whites and blacks). Indeed, I still can’t fit the 1958 approval number into my understanding of public opinion. | In some ways that second number (the total percentage of marriages that are between blacks and whites) is somewhat of a trick question. Still, I’m surprised how far off my intuition was on both these numbers (the rate of approval of interracial marriage in 1958, and the current percentage of marriages that are between whites and blacks). Indeed, I still can’t fit the 1958 approval number into my understanding of public opinion. | ||
<br><br> | <br><br> | ||
I never would’ve guessed the numbers would be so high. My continued astonishment here is a sign to me that I need to further rejigger my mental model of public opinion to handle this data point. | ...I never would’ve guessed the numbers would be so high. My continued astonishment here is a sign to me that I need to further rejigger my mental model of public opinion to handle this data point. | ||
</blockquote> | </blockquote> | ||
Revision as of 22:02, 12 January 2015
Graphic on marriage
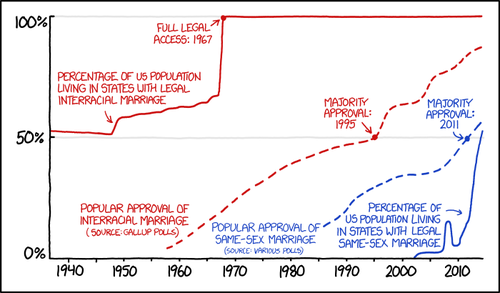
The following is a cartoon from XKCD:
It is reproduced on Andrew Gelman's blog (November 28, 2014) in a post entitled Quantitative literacy is tough! Or, I had no idea that, in 1958, 96% of Americans disapproved of interracial marriage!
Gelman writes
And I was stunned, first by the data on interracial marriage and then, retrospectively, by my earlier ignorance of these data. Was approval of interracial marriage only 4% in 1958? I had no idea. I looked it up at the Gallup site and it seems to be so. But it’s just hard for me to get my head around this. I mean, sure, I know that attitudes on racial issues have changed a lot, but still . . . 4 percent?? If you’d’ve asked me, I might have guessed 30 percent, or 20 percent, certainly I never would’ve given any number close to 4 percent.
In some ways that second number (the total percentage of marriages that are between blacks and whites) is somewhat of a trick question. Still, I’m surprised how far off my intuition was on both these numbers (the rate of approval of interracial marriage in 1958, and the current percentage of marriages that are between whites and blacks). Indeed, I still can’t fit the 1958 approval number into my understanding of public opinion.
...I never would’ve guessed the numbers would be so high. My continued astonishment here is a sign to me that I need to further rejigger my mental model of public opinion to handle this data point.
Some math doodles
<math>P \left({A_1 \cup A_2}\right) = P\left({A_1}\right) + P\left({A_2}\right) -P \left({A_1 \cap A_2}\right)</math>
Accidental insights
My collective understanding of Power Laws would fit beneath the shallow end of the long tail. Curiosity, however, easily fills the fat end. I long have been intrigued by the concept and the surprisingly common appearance of power laws in varied natural, social and organizational dynamics. But, am I just seeing a statistical novelty or is there meaning and utility in Power Law relationships? Here’s a case in point.
While carrying a pair of 10 lb. hand weights one, by chance, slipped from my grasp and fell onto a piece of ceramic tile I had left on the carpeted floor. The fractured tile was inconsequential, meant for the trash.

As I stared, slightly annoyed, at the mess, a favorite maxim of the Greek philosopher, Epictetus, came to mind: “On the occasion of every accident that befalls you, turn to yourself and ask what power you have to put it to use.” Could this array of large and small polygons form a Power Law? With curiosity piqued, I collected all the fragments and measured the area of each piece.
| Piece | Sq. Inches | % of Total |
|---|---|---|
| 1 | 43.25 | 31.9% |
| 2 | 35.25 | 26.0% |
| 3 | 23.25 | 17.2% |
| 4 | 14.10 | 10.4% |
| 5 | 7.10 | 5.2% |
| 6 | 4.70 | 3.5% |
| 7 | 3.60 | 2.7% |
| 8 | 3.03 | 2.2% |
| 9 | 0.66 | 0.5% |
| 10 | 0.61 | 0.5% |

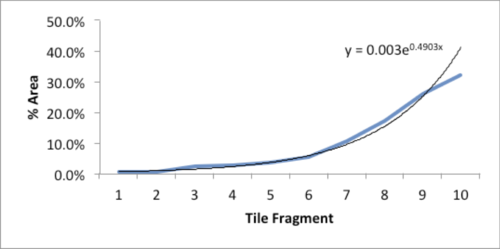
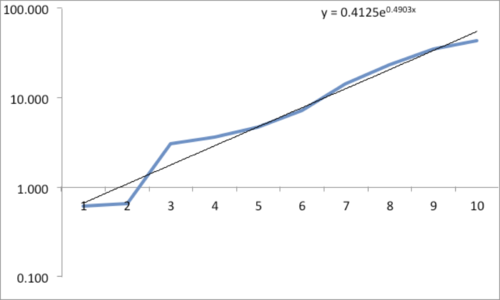
The data and plot look like a Power Law distribution. The first plot is an exponential fit of percent total area. The second plot is same data on a log normal format. Clue: Ok, data fits a straight line. I found myself again in the shallow end of the knowledge curve. Does the data reflect a Power Law or something else, and if it does what does it reflect? What insights can I gain from this accident? Favorite maxims of Epictetus and Pasteur echoed in my head: “On the occasion of every accident that befalls you, remember to turn to yourself and inquire what power you have to turn it to use” and “Chance favors only the prepared mind.”

My “prepared” mind searched for answers, leading me down varied learning paths. Tapping the power of networks, I dropped a note to Chance News editor Bill Peterson. His quick web search surfaced a story from Nature News on research by Hans Herrmann, et. al. Shattered eggs reveal secrets of explosions. As described there, researchers have found power-law relationships for the fragments produced by shattering a pane of glass or breaking a solid object, such as a stone. Seems there is a science underpinning how things break and explode; potentially useful in Forensic reconstructions. Bill also provided a link to a vignette from CRAN describing a maximum likelihood procedure for fitting a Power Law relationship. I am now learning my way through that.
Submitted by William Montante
