Sandbox: Difference between revisions
| Line 1: | Line 1: | ||
== | ==Cancer and luck== | ||
[http://www.nytimes.com/2015/01/06/health/cancers-random-assault.html?action=click&contentCollection=U.S.&module=MostEmailed&version=Full®ion=Marginalia&src=me&pgtype=article Cancer’s random assault]<br> | |||
By Denise Grady, ''New York Times'', 5 January 2015 | |||
The article concerns a recent research paper, [http://www.sciencemag.org/content/347/6217/78 Variation in cancer risk among tissues can be explained by the number of stem cell divisions] (''Science'' 2 January 2015). From the abstract | |||
<blockquote> | |||
Here, we show that the lifetime risk of cancers of many different types is strongly correlated (0.81) with the total number of divisions of the normal self-renewing cells maintaining that tissue’s homeostasis. These results suggest that only a third of the variation in cancer risk among tissues is attributable to environmental factors or inherited predispositions. | |||
</blockquote> | |||
News coverage has created controversy by summarizing the findings in more colloquial terms, similar to this from the NYT article: | |||
<blockquote> | |||
Random mutations may account for two-thirds of the risk of getting many types of cancer, leaving the usual suspects — heredity and environmental factors — to account for only one-third, say the authors, Cristian Tomasetti and Dr. Bert Vogelstein, of Johns Hopkins University School of Medicine. | |||
</blockquote> | |||
Of course, saying that two-thirds of the variation among cancer types is "explained" by the rate of cell division is not the same thing as saying that two-thirds of risk of a particular cancer is can be accounted for by chance, or that two-thirds of all cancer cases are attributable to bad luck. But versions of these latter interpretations have in appeared in various responses to the article. For example, one [http://www.nytimes.com/2015/01/13/science/your-letters-cancers-luck-earth-like-planets-and-protecting-pedestrians.html letter to the NYT] commented, "If their conclusion is correct, that two-thirds of many cancer types are caused by random mutations, then we have a long road ahead." Or consider this headline from ''Forbes'': [http://www.forbes.com/sites/geoffreykabat/2015/01/04/most-cancers-may-simply-be-due-to-bad-luck/ Most cancers may simply be due to bad luck]. | |||
The resulting confusion is addressed in | |||
:[http://news.sciencemag.org/biology/2015/01/bad-luck-and-cancer-science-reporter-s-reflections-controversial-story Bad luck and cancer: A science reporter’s reflections on a controversial story]<br> | |||
:by Jennifer Couzin-Frankel, ''Science Insider'', 13 January 2015 | |||
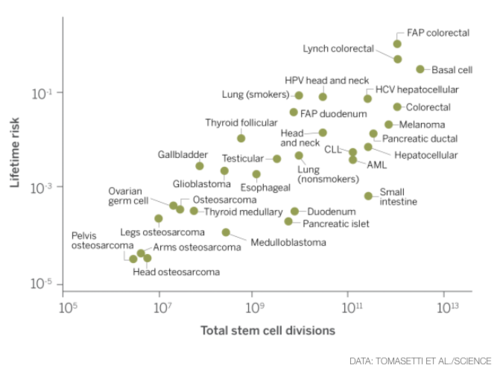
This article presents the following data graphic of the relationship | |||
<center> | |||
[[File:Sn-cancer.png | 500px]] | |||
</center> | |||
We now see where the two-thirds comes from: if the correlation coefficient <math>r = 0.81</math>, as noted in the abstract above, then <math>R^2=0.66</math>. | |||
In response to the controversy, Drs. Tomasetti and Vogelstein (the study's authors), offered some clarifying remarks in an addendum to the original [http://www.hopkinsmedicine.org/news/media/releases/bad_luck_of_random_mutations_plays_predominant_role_in_cancer_study_shows Johns Hopkins news release]. In particular, they construct the following extended analogy with driving a car: the road conditions correspond to environmental factors; the condition of your car corresponds to hereditary factors; the length of the trip corresponds to the number of cell divisions; and the risk of having an a accident corresponds to the risk of getting cancer. It makes sense that for any combination of car and road conditions, your risk of an accident increases with the length of the trip. Nevertheless, this does not suggest that you should routinely neglect to service your vehicle or or to intelligently plan your routes. | |||
'''Discussion''' | |||
1. The original headline of the news release was "Bad Luck of Random Mutations Plays Predominant Role in Cancer, Study Shows." Do you think this could have contributed to the misinterpretations? Can you suggest another wording? | |||
2. Consider the same questions for the ''NYT'' headline, "Cancer's random assault." | |||
Submitted by Bill Peterson | |||
==More on Gini== | ==More on Gini== | ||
Revision as of 19:58, 15 February 2015
Cancer and luck
Cancer’s random assault
By Denise Grady, New York Times, 5 January 2015
The article concerns a recent research paper, Variation in cancer risk among tissues can be explained by the number of stem cell divisions (Science 2 January 2015). From the abstract
Here, we show that the lifetime risk of cancers of many different types is strongly correlated (0.81) with the total number of divisions of the normal self-renewing cells maintaining that tissue’s homeostasis. These results suggest that only a third of the variation in cancer risk among tissues is attributable to environmental factors or inherited predispositions.
News coverage has created controversy by summarizing the findings in more colloquial terms, similar to this from the NYT article:
Random mutations may account for two-thirds of the risk of getting many types of cancer, leaving the usual suspects — heredity and environmental factors — to account for only one-third, say the authors, Cristian Tomasetti and Dr. Bert Vogelstein, of Johns Hopkins University School of Medicine.
Of course, saying that two-thirds of the variation among cancer types is "explained" by the rate of cell division is not the same thing as saying that two-thirds of risk of a particular cancer is can be accounted for by chance, or that two-thirds of all cancer cases are attributable to bad luck. But versions of these latter interpretations have in appeared in various responses to the article. For example, one letter to the NYT commented, "If their conclusion is correct, that two-thirds of many cancer types are caused by random mutations, then we have a long road ahead." Or consider this headline from Forbes: Most cancers may simply be due to bad luck.
The resulting confusion is addressed in
- Bad luck and cancer: A science reporter’s reflections on a controversial story
- by Jennifer Couzin-Frankel, Science Insider, 13 January 2015
This article presents the following data graphic of the relationship
We now see where the two-thirds comes from: if the correlation coefficient <math>r = 0.81</math>, as noted in the abstract above, then <math>R^2=0.66</math>.
In response to the controversy, Drs. Tomasetti and Vogelstein (the study's authors), offered some clarifying remarks in an addendum to the original Johns Hopkins news release. In particular, they construct the following extended analogy with driving a car: the road conditions correspond to environmental factors; the condition of your car corresponds to hereditary factors; the length of the trip corresponds to the number of cell divisions; and the risk of having an a accident corresponds to the risk of getting cancer. It makes sense that for any combination of car and road conditions, your risk of an accident increases with the length of the trip. Nevertheless, this does not suggest that you should routinely neglect to service your vehicle or or to intelligently plan your routes.
Discussion
1. The original headline of the news release was "Bad Luck of Random Mutations Plays Predominant Role in Cancer, Study Shows." Do you think this could have contributed to the misinterpretations? Can you suggest another wording?
2. Consider the same questions for the NYT headline, "Cancer's random assault."
Submitted by Bill Peterson
More on Gini
The analysis received news coverage elsewhere, for example:
- How airline seating reflects income inequality
- by Michael Hiltzik, Los Angeles Times, 2 December 2014
Some math doodles
<math>P \left({A_1 \cup A_2}\right) = P\left({A_1}\right) + P\left({A_2}\right) -P \left({A_1 \cap A_2}\right)</math>
Accidental insights
My collective understanding of Power Laws would fit beneath the shallow end of the long tail. Curiosity, however, easily fills the fat end. I long have been intrigued by the concept and the surprisingly common appearance of power laws in varied natural, social and organizational dynamics. But, am I just seeing a statistical novelty or is there meaning and utility in Power Law relationships? Here’s a case in point.
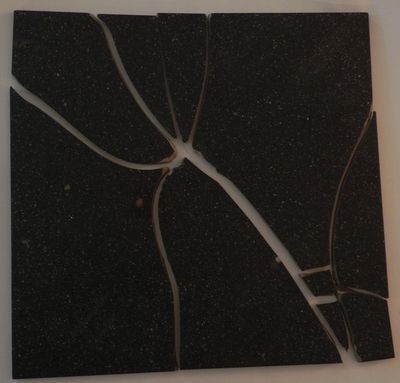
While carrying a pair of 10 lb. hand weights one, by chance, slipped from my grasp and fell onto a piece of ceramic tile I had left on the carpeted floor. The fractured tile was inconsequential, meant for the trash.

As I stared, slightly annoyed, at the mess, a favorite maxim of the Greek philosopher, Epictetus, came to mind: “On the occasion of every accident that befalls you, turn to yourself and ask what power you have to put it to use.” Could this array of large and small polygons form a Power Law? With curiosity piqued, I collected all the fragments and measured the area of each piece.
| Piece | Sq. Inches | % of Total |
|---|---|---|
| 1 | 43.25 | 31.9% |
| 2 | 35.25 | 26.0% |
| 3 | 23.25 | 17.2% |
| 4 | 14.10 | 10.4% |
| 5 | 7.10 | 5.2% |
| 6 | 4.70 | 3.5% |
| 7 | 3.60 | 2.7% |
| 8 | 3.03 | 2.2% |
| 9 | 0.66 | 0.5% |
| 10 | 0.61 | 0.5% |

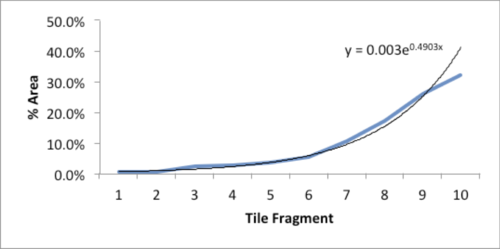
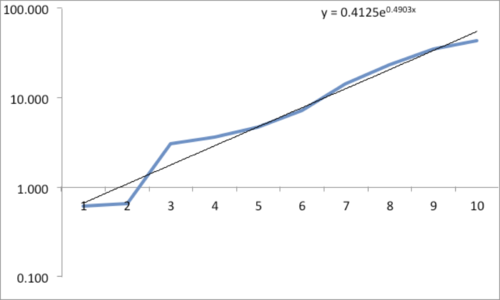
The data and plot look like a Power Law distribution. The first plot is an exponential fit of percent total area. The second plot is same data on a log normal format. Clue: Ok, data fits a straight line. I found myself again in the shallow end of the knowledge curve. Does the data reflect a Power Law or something else, and if it does what does it reflect? What insights can I gain from this accident? Favorite maxims of Epictetus and Pasteur echoed in my head: “On the occasion of every accident that befalls you, remember to turn to yourself and inquire what power you have to turn it to use” and “Chance favors only the prepared mind.”

My “prepared” mind searched for answers, leading me down varied learning paths. Tapping the power of networks, I dropped a note to Chance News editor Bill Peterson. His quick web search surfaced a story from Nature News on research by Hans Herrmann, et. al. Shattered eggs reveal secrets of explosions. As described there, researchers have found power-law relationships for the fragments produced by shattering a pane of glass or breaking a solid object, such as a stone. Seems there is a science underpinning how things break and explode; potentially useful in Forensic reconstructions. Bill also provided a link to a vignette from CRAN describing a maximum likelihood procedure for fitting a Power Law relationship. I am now learning my way through that.
Submitted by William Montante
