Sandbox: Difference between revisions
| Line 75: | Line 75: | ||
{| class="wikitable" | {| class="wikitable" | ||
|- | |- | ||
! <br>Digit !! First digit <br>frequency !! Second digit<br>frequency | ! <br>Digit !! First digit<br> frequency !! Second digit<br>frequency | ||
|- | |- | ||
| 0 ||--- ||0.11968 | | 0 ||--- ||0.11968 | ||
| Line 104: | Line 104: | ||
* The numbers should not be assigned. Assigned numbers are those given to objects to identify them. Examples are social security, bank account, and telephone numbers. | * The numbers should not be assigned. Assigned numbers are those given to objects to identify them. Examples are social security, bank account, and telephone numbers. | ||
See [http://www.usfca.edu/fac-staff/huxleys/Benford.html] for the distribution of the first through fifth digits. Unlike the leading digit which is never a zero, these subsequent digits tend to a uniform distribution of 1/10. | See [http://www.usfca.edu/fac-staff/huxleys/Benford.html here] for the distribution of the first through fifth digits. Unlike the leading digit which is never a zero, these subsequent digits tend to a uniform distribution of 1/10. | ||
2. Poundstone’s Chapter 22, “How to Outguess the Stock Market,” is his longest chapter and perhaps the most puzzling. Here we are potentially dealing with real money, namely yours. He is enamored with the Shiller PE ratio and is quite emphatic, without the usual “the past may not be an indicator of future performance” hedge. | 2. Poundstone’s Chapter 22, “How to Outguess the Stock Market,” is his longest chapter and perhaps the most puzzling. Here we are potentially dealing with real money, namely yours. He is enamored with the Shiller PE ratio and is quite emphatic, without the usual “the past may not be an indicator of future performance” hedge. | ||
Revision as of 19:37, 12 August 2014
Anchors, ultimatums and randomization
William Poundstone writes wonderful, interesting books, veritable page turners. Some of his previous works were reviewed in Chance News here and here. Because he has set such a personal high bar, his latest two books while fun to read, don’t quite match his earlier output.
His 2010 book, Priceless: The Myth of Fair Value (and How to Take Advantage of It) focuses on the concept of anchoring which Wikipedia describes as
A person begins with a first approximation (anchor) and then makes incremental adjustments based on additional information. These adjustments are usually insufficient, giving the initial anchor a great deal of influence over future assessments.
Thus says Poundstone, anchoring is beloved by behavioral economists, market consultants, advertisers, marketers, psychologists, attorneys and any other entities that wish to influence/fleece the unwary consumer/opponent. In essence, the public and the individual are easily manipulated by the mere mention of a number--a high number elicits high numbers and a low number brings forth low numbers. For example on page 11, if a (meaningless) random number (from a rigged spinning wheel) is 65, the participants claimed (on average) that the percentage of African nations in the U.N. is 45 percent whereas if the (meaningless) random number (from a rigged spinning wheel) is 10, the participants claimed (on average) that the percentage of African nations in the U.N. is 25 percent.
In case you are wondering, the correct fraction of African U.N. member nations is 23 percent.
Much of the rest of the book is devoted to tales of how anchoring and its offshoots can be used to swindle the general public. He turns the famous Oscar Wilde saying “A cynic is a man who knows the price of everything, and the value of nothing” on its head in the sense that, just as with “value,” there is no such thing as price; for instance, price is easily manipulated by means of lowering the weight of a package while keeping the price the same as before. Another common commercial technique is to run non-special special discounts.
Less well-known is the procedure supermarkets employ:
Shoppers open their wallets wider when moving through a store in a counterclockwise direction. On average, these shoppers spend $2 more a trip than clockwise shoppers…[Because] North Americans see shopping carts as ‘cars” to be driven to the right…By this theory, the right-handed majority finds it easier to make impulse purchases when the wall or shelf is to the right…[resulting in] markets putting their main entrance on the right of the store’s layout to encourage counterclockwise shopping
Particularly amusing is his Chapter 27, “Menu Psych,” where he demonstrates how a restaurant menu can be designed to avoid “A diner who orders based on price” because said diner “is not a profitable diner.”
The real agenda of the $110 price [of the seafood plate] is probably to induce customers to spring for the $65 Le Grand plate just to the left of it or the more modest seafood orders below it.
This modus operandi of an absurdly overpriced option in order to induce the buyer to choose a slightly less overpriced option can be applied to many fields from handbags to stadium seats and imported wine.
Then there is the ultimatum game:
[T]he ultimatum game is a game often played in economic experiments in which two players interact to decide how to divide a sum of money that is given to them. The first player proposes how to divide the sum between the two players, and the second player can either accept or reject this proposal. If the second player rejects, neither player receives anything. If the second player accepts, the money is split according to the proposal. The game is played only once so that reciprocation is not an issue.
Obviously, the word “game” is a euphemism and particularly amusing is Poundstone’s discussion of Jack Welch’s divorce proceedings whereby Welch, the former head of GE, made an initial offer which his wife refused resulting in all the lawyers involved profiting mightily.
As negotiations dragged on, Jack was offering Jane a temporary allowance of $35,000 a month. To a woman of Jane’s sense of entitlement, that didn’t go far enough [!]. It was time for Jane to play the ultimatum game.
Eventually, he blinked and
By one calculation, Jane’s ultimatum had cost the couple $2.5 million a year for the rest of their lives.
Poundstone’s 2014 book, Rock Breaks Scissors: A Practical Guide to Outguessing & Outwitting Almost Everybody spotlights the role randomness can play in competitive games such as the classic “rock, scissors, paper,” but also salary negotiations, computer passwords, multiple-choice tests, financial fraud, office pools, stock market investing, the Oscar pools. The chapters tend to be short with a recap at the end of each chapter.
Rock, scissors, paper is a well known betting game which exemplifies non-transitivity: A > B, B > C but C > A where the symbol “>” means dominates.
His Chapter 13, “How to Outguess Ponzi Schemes” concludes with
Be suspicious when too many numbers just top a psychologically significant threshold.
Although he doesn’t say so, this is reminiscent of p-hacking whereby frequentists’ p-values just go under the magical .05 in order convince journal reviewers that the study should be published.
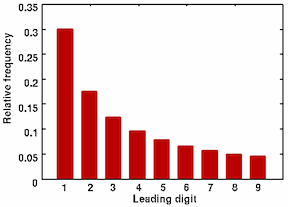
The most interesting chapter for statisticians is Chapter 11, “How to Outguess Fake Numbers.” He looks at the famous Benford Law of the leading digit which, to the surprise of many a convicted fraudster, is not a uniform distribution where each digit is equally likely and equal to 1/9. From Plus magazine the distribution of the leading digit is:

In this age of password hacking, Poundstone proposes using randomization and mnemonics to foil the hackers. For example, for the random password RPM8t4ka
RPM8t4ka might become revolutions per minute, 8 track for Kathy.
Big Data is the rage these days, so his Chapter 18, “Outguessing Big Data,” is a must read. In this age of plastic, your cell phone carrier, bank, cable company, etc., know everything about you, including the likelihood that you might switch to a competitor who is about to have an alluring blitz campaign.
You’ve probably gotten weird calls…The call means that an algorithm has predicted that you are likely to “churn” (cancel your service)…you’ll be presented with the so-called primary offer…Never accept a primary offer. Once you reject it, the caller will bring up the secondary offer. It’s all in the script. Sometimes the second offer is better; other times it’s just different…You can always reverse yourself and ask for the first after hearing the second. A still better strategy is to reject all offers. Wait a few days and then call to cancel the service. (Do this even if you intend to keep it).
Another technique for outguessing Big Data is to phone the large corporation via Google Voice because
Your Internet phone number is likely to have less data attached to it than your main number…This time the software will see your Internet phone number, not your regular one…Companies want new customers, so they are unlikely to lump blank slate numbers in with the bad apples.
Discussion
1. From this article by Mark Nigrini, we find
Digit |
First digit frequency |
Second digit frequency |
|---|---|---|
| 0 | --- | 0.11968 |
| 1 | 0.30103 | 0.11389 |
| 2 | 0.17609 | 0.10882 |
| 3 | 0.12494 | 0.10433 |
| 4 | 0.09691 | 0.10031 |
| 5 | 0.07918 | 0.09668 |
| 6 | 0.06695 | 0.09337 |
| 7 | 0.05799 | 0.09035 |
| 8 | 0.05115 | 0.08757 |
| 9 | 0.04576 | 0.08500 |
Not all data sets are expected to have the digit frequencies of Benford’s Law: therefore, the guidelines for deciding whether a data set would comply are that:
- The numbers in the data set should describe the sizes of the elements in the data set.
- There should be no built-in maximum or minimum to the numbers. A maximum or minimum that occurs often would cause many numbers to have the digit patterns of the maximum or minimum.
- The numbers should not be assigned. Assigned numbers are those given to objects to identify them. Examples are social security, bank account, and telephone numbers.
See here for the distribution of the first through fifth digits. Unlike the leading digit which is never a zero, these subsequent digits tend to a uniform distribution of 1/10.
2. Poundstone’s Chapter 22, “How to Outguess the Stock Market,” is his longest chapter and perhaps the most puzzling. Here we are potentially dealing with real money, namely yours. He is enamored with the Shiller PE ratio and is quite emphatic, without the usual “the past may not be an indicator of future performance” hedge.
For still better returns,…When the Shiller PE rises above 24, check the market monthly and sell whenever the market falls 6 percent or more from a recent high. Keep the proceeds in fixed income investments. Then, when Shiller PE falls below 15, check the market monthly and buy back into the market whenever the PE rises 6 percent or more from a recent low.
3. Unfortunately, Poundstone seriously misleads when he naively cites the many behavioral economic studies which say, more or less, that the average of one (convenient) group (of university students) is different from another (convenient) group (of university students). Without referring to variability between the groups, the average difference is virtually meaningless. In addition, even if the difference is significant (statistically and practically), it is quite a leap to infer that this difference involving university students at MIT and the University of Chicago applies to all of humankind spatially and temporally.
Submitted by Paul Alper
MicroMorts
Margaret Cibes sent a link to the following:
Risk is never a strict numbers game
by Michael Blastland and David Spiegelhalter, Wall Street Journal, 18 July 2014
Noting that people are notoriously bad at weighing risks (e.g., in preferring driving to flying), this essay explains the use MicroMorts to simplify comparisons. This unit of measure is death per million is credited to Stanford professor Ronald Howard.
David Spiegelhalter is member of the Understanding Uncertainty project, based at the Statistical Laboratory in the University of Cambridge.
Micromorts, horses and ecstasy
Understanding uncertainty: Small but lethal
by David Spiegelhalter and Mike Pearson, Plus magazine, 12 July 2010
Accidental insights
My collective understanding of Power Laws would fit beneath the shallow end of the long tail. Curiosity, however, easily fills the fat end. I long have been intrigued by the concept and the surprisingly common appearance of power laws in varied natural, social and organizational dynamics. But, am I just seeing a statistical novelty or is there meaning and utility in Power Law relationships? Here’s a case in point.
While carrying a pair of 10 lb. hand weights one, by chance, slipped from my grasp and fell onto a piece of ceramic tile I had left on the carpeted floor. The fractured tile was inconsequential, meant for the trash.

As I stared, slightly annoyed, at the mess, a favorite maxim of the Greek philosopher, Epictetus, came to mind: “On the occasion of every accident that befalls you, turn to yourself and ask what power you have to put it to use.” Could this array of large and small polygons form a Power Law? With curiosity piqued, I collected all the fragments and measured the area of each piece.
| Piece | Sq. Inches | % of Total |
|---|---|---|
| 1 | 43.25 | 31.9% |
| 2 | 35.25 | 26.0% |
| 3 | 23.25 | 17.2% |
| 4 | 14.10 | 10.4% |
| 5 | 7.10 | 5.2% |
| 6 | 4.70 | 3.5% |
| 7 | 3.60 | 2.7% |
| 8 | 3.03 | 2.2% |
| 9 | 0.66 | 0.5% |
| 10 | 0.61 | 0.5% |

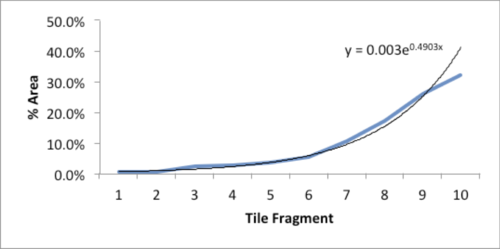
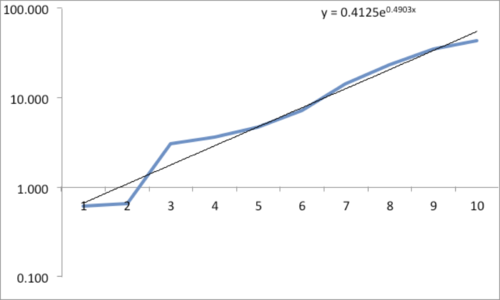
The data and plot look like a Power Law distribution. The first plot is an exponential fit of percent total area. The second plot is same data on a log normal format. Clue: Ok, data fits a straight line. I found myself again in the shallow end of the knowledge curve. Does the data reflect a Power Law or something else, and if it does what does it reflect? What insights can I gain from this accident? Favorite maxims of Epictetus and Pasteur echoed in my head: “On the occasion of every accident that befalls you, remember to turn to yourself and inquire what power you have to turn it to use” and “Chance favors only the prepared mind.”

My “prepared” mind searched for answers, leading me down varied learning paths. Tapping the power of networks, I dropped a note to Chance News editor Bill Peterson. His quick web search surfaced a story from Nature News on research by Hans Herrmann, et. al. Shattered eggs reveal secrets of explosions. As described there, researchers have found power-law relationships for the fragments produced by shattering a pane of glass or breaking a solid object, such as a stone. Seems there is a science underpinning how things break and explode; potentially useful in Forensic reconstructions. Bill also provided a link to a vignette from CRAN describing a maximum likelihood procedure for fitting a Power Law relationship. I am now learning my way through that.
Submitted by William Montante
Reproducibility
When studies are wrong: A coda
by George Johnson, New York Times, 7 March 2014
Submitted by Bill Peterson
Finding lost aircraft
Jeanne Albert sent a link to the following
How statisticians found Air France Flight 447 two years after it crashed into Atlantic
MIT Technology Review, 27 May 2014
How statisticians could help find that missing plane, by Carl Bialik, FiveThirtyEight, 17 March 2014