File:GenLingCorrs.jpg
GenLingCorrs.jpg (300 × 262 pixels, file size: 9 KB, MIME type: image/jpeg)
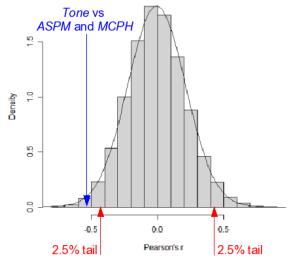
http://www.ling.ed.ac.uk/~s0340638/tonegenes/tonegenessummary.html The distribution of the correlations between all pairs of genetic markers and linguistic features in our database. The horizontal axis represents the strength of the correlation (Pearson's r, between -1 and +1, 0 means no correlation). It can be seen that most correlations are around zero, but that the correlation between tone and ASPM, and tone and Microcephalin, respectively, are very improbable (stronger than 98.6% of all the correlations). It must be noted that the correlation between tone and ASPM, and tone and Microcephalin are highly significant
File history
Click on a date/time to view the file as it appeared at that time.
| Date/Time | Thumbnail | Dimensions | User | Comment | |
|---|---|---|---|---|---|
| current | 14:03, 16 June 2007 | | 300 × 262 (9 KB) | Gavinj (talk | contribs) | http://www.ling.ed.ac.uk/~s0340638/tonegenes/tonegenessummary.html The distribution of the correlations between all pairs of genetic markers and linguistic features in our database. The horizontal axis represents the strength of the correlation (Pearson's |
You cannot overwrite this file.
File usage
The following page uses this file: