Chance News 78
October 3, 2011 to November 2, 2011
Quotations
"Data is not information, information is not knowledge, knowledge is not understanding, understanding is not wisdom." -- Clifford Stoll
Submitted by Steve Simon
"Conclusion. Lose your inhibitions: Put probabilities on parameters without embarrassment." -- Christopher A. Sims (new Nobel Laureate in Economics)
Submitted by Paul Alper
“Humans are hard-wired to deny low-probability, high-impact events. ...If you want to sell earthquake preparation in a way that it affects human behavior, you have to sell it like Coca-Cola." --Dennis Mileti (emeritus professor of behavioral science, University of Colorado at Boulder)
Submitted by Bill Peterson
Forsooth
"Can anyone legitimately deny that replacing that year of geometry, chemistry, or the third or fourth year of foreign language with a year of entrepreneurship education would be more beneficial to our students and, in turn, to society, in thinking skills and in additional jobs created?"
But what evidence is offered for this claim? One personal quote, from a consulting engineer who says, “In my 20 years as an engineer for Chevron and Conoco-Phillips, I never used geometry. A course in entrepreneurship would have been far more valuable.” Meanwhile, the online article includes interactive voluntary response poll (dutifully labeled "unscientific"), where readers can weigh in on the question "Should high schools replace geometry with entrepreneurship class?"
Submitted by Paul Alper
Is the following a Forsooth?
"There’s at least as much as an 80 percent chance that Greece will leave the 17-nation common currency in the next 10 years."
--Economist Kenneth Rogoff, as quoted in Bloomberg News, 27 October 2011
As noted at Junkcharts, combining "at least...an 80 percent chance" and "...as much as an 80% chance" might seem to cover the whole range from 0 to 100%. Discussion and comments on Andrew Gelman's blog suggest that obvious editing would have rendered this as "the chance is greater than 80%." Still, it doesn't help that the article was titled "Greece Will Eventually Leave Euro, Rogoff Says"!
Submitted by Paul Alper
Cheerful tweets in the morning
Twitter Study Tracks When We Are :) by Benedict Carey, The New York Times, September 29, 2011
If you read the mood of people on Twitter, they are happy in the morning, but then things go downhill.
However grumpy people are when they wake up, and whether they stumble to their feet in Madrid, Mexico City or Minnetonka, Minn., they tend to brighten by breakfast time and feel their moods taper gradually to a low in the late afternoon, before rallying again near bedtime, a large-scale study of posts on the social media site Twitter found.
How can you measure this? The researchers
analyzed the text of each message, using a standard computer program that associates certain words, like “awesome” and “agree,” with positive moods and others, like “annoy” and “afraid,” with negative ones. They included so-called emoticons, the face symbols like “:)” that punctuate digital missives.
It's not an accurate sample, though, as the researchers admit.
For starters, Twitter users are computer-savvy, skew young and affluent, and post for a variety of reasons.
You might think that going to work causes a decline in mood, but the same burst of enthusiasm occurs on Saturday and Sunday mornings, but two hours later than on weekdays. There is, however, no evidence for Seasonal Affective Disorder, the tendency of people to become depressed near Christmas when the days are the shortest. Here's a graph showing the daily trends.
Questions
- What aspects of Twitter make you nervous about these findings?
- Can sentiments like happiness be discovered adequately by text analysis? Does the 140 character limit in Twitter make this more difficult or easier?
Submitted by Steve Simon
Comment: The new wave of social media data research
With all the publicly available data, a new wave of “social media” research is gaining momentum. As indicated in the preceding story, statisticians, computer scientists, and social scientists are joining forces to tackle the massive amount of social data available through websites such as Twitter and MySpace. The NPR story Using Twitter to Tap Into the Mood of the Planet by Christoper Joyce (29 September 2011) reports on a recent study by Scott Golder and Michael Macy, social scientists at Cornell, published in the 30 September 2011 issue of Science (Vol. 333, Issue 6501, pp. 1878-1881). Golder and Macy asked “How do peoples' moods go up and down — positive or negative — through the day?” The researchers scanned text for key words that reflect the writer’s mood in tweets by more than 2 million people in 84 countries. They found two peaks in positive moods during the day – first thing in the morning and late at night. They point out that it is hard to draw any causal connections due to the nature of the data.
Social media data research also appeared in Hans Rosling’s documentary The Joy of Stats, broadcast by BBC in 2010. Dr. Rosling’s documentary interviews Sep Kamvar, Professor of Computational Science at Stanford University, who, along with Jonathan Harris, runs a social media research project called We Feel Fine. Since 2005, this study goes beyond tweets alone, and collects blog data from over nine sources measuring fourteen variables including feeling, time, date, gender, age, and country. We Feel Fine’s data includes several million human feelings, and increases by 15,000-20,000 feelings per day. The data is stored in a database and can be searched across a number of demographic slices using their applet.
It is becoming easier and easier to access social media data. In addition to the “We Feel Fine” applet, the R library twitteR by Jeff Gentry includes R functions to pull live data from Twitter through R. This bulk of data provides great opportunities for student projects and interdisciplinary research.
Discussion
Each observation in a social media data set includes a user name, date/time, and a “sentence.” Often, you can obtain demographic data about each user as well, such as location, gender, and age. Think of possible research questions we might be able to examine with this type of data.
Submitted by Stacey Hancock
Fool’s gold standard
“Buy low, sell high and “avoid trauma” are good aphorisms to live by. So is “never take medication or have a medical procedure performed that has been in use for less than twenty-five years.” And, that is even if said medication or procedure has been approved by the so-called gold standard, a clinical trial. In Chance News 76 one type of what might be called a “fool’s gold standard,” seeding trials, is discussed.
Another version of the fool’s gold standard is the subject of an article entitled The Other South American Drug War, by Kelly Hearn in The Nation (print version to appear 11 October 2011). Hearn describes the subverting of clinical trials by means of “offshoring” clinical trials and Independent Review Boards to South America.
Foreign clinical trials for US-bound drugs have been commonplace for decades, and ethical breaches are a frequent side effect.
A generation ago, most human testing took place in American academic institutions. Now it’s a global game dominated by corporations, called contract research organizations (CROs), that help Big Pharma bring new molecules from the lab to your medicine cabinet. More and more drug companies are turning to CROs for assistance with trial design and recruitment, regulatory compliance, marketing and branding—last year the CRO market was worth $20 billion, an estimated 100 percent jump from a decade ago. And CROs, in turn, are increasingly running trials in the developing world because doing so is cheaper and faster: regulations aren’t as onerous, patient recruitment is easier and informed consent is less clearly defined.
Peru, a nation of 30 million where few people have health insurance and one in three lives in poverty, has the highest number of volunteer patients in South America and ranks among the world’s leaders in total number of clinical trials. In 2008 more than 13,000 Peruvians took part in trials testing drugs intended for the United States. The FDA did not send a single inspector.
It is unnerving to read how easily the system is being gamed.
Discussion
- Hearn quotes someone who states, “A big fear is that reckless researchers or firms may find it easy to go far from regulatory scrutiny and conduct preliminary, early-phase research off the record to find out whether to abandon the idea or to pursue it in the licit, on-the-record procedures.” Why is this a big fear?
- How does number 1 relate to the so-called “file drawer problem of statistics”?
- According to Hearn, “the number of trials in developing countries has grown 8 percent a year since 1997. A 2010 report by the inspector general of the Department of Health and Human Services (HHS) notes that 40 to 65 percent of clinical trials on FDA-regulated products in 2008 took place overseas. Of nearly 6,500 foreign trial sites that year, the FDA inspected only forty-five—less than 1 percent.” If Hearn’s allegations are on the mark, why have we not heard more about them in the mainstream media?
- In the news last month has been criticism of an earlier ethically indefensible use of a clinical trial in Guatemala here.
Submitted by Paul Alper
Saw palmetto and LUTS
As most older men will attest, lower urinary tract symptoms or LUTS in the form of BPH or benign prostatic hyperplasia, is at minimum annoying, and often quite painful. The most common plant extract for treating BPH is the fruit of the saw palmetto dwarf palm tree. Saw palmetto is relatively inexpensive, around 20 to 30 dollars for a so-called month supply and according to The Saw Palmetto Trading Company
Numerous double-blind clinical studies on the Saw palmetto extract have shown it to be effective in nearly 90% of patients usually in a period of 4 to 6 weeks. Detailed toxicity studies in animals, as well as the results from clinical trials, indicate that the Saw palmetto extract is without toxicity or side effect. Despite the impressive clinical effectiveness, safety, and popularity of Saw palmetto extract in the treatment of BPH in the United States, manufacturers are prohibited from making any medical claims by the FDA.
Clinical studies demonstrating the efficacy of Saw palmetto in BPH:
| Authors | Type of Study | No. of patients | Length of study | Results |
|---|---|---|---|---|
| Boccafoschi, et al | Double-blind | 22 | 60 days | Significant difference for volume voided, maximum flow, mean flow, dysuria, nocturia |
| Cirillo,et al | Open | 47 | 4 months | Significant difference for: dysuria, nocturia, urine flow |
| Tripodi, et al | Open | 40 | 30-90 days | Significant difference for: dysuria, nocturia, volume of prostate, voiding rate, residual urine |
| Emili, et al | Double-blind | 30 | 30 days | Significant difference for: number of voidings, strangury, maximum and mean urine flow, residual urine |
| Greca, et al | Open | 14 | 1 to 2 months | Significant difference for: dysuria, perincal heaviness, nocturia, volume of urine per voiding, interval between two dumal voidings, sensation of incomplete voiding |
| Duvia, et al | Controlled trial vs. pygeum | 30 | 30 days | Significant difference for voiding rate |
| Tasca, et al | Double-blind | 30 | 31 to 90 days | Significant difference for: frequency, urine flow measurement |
However, a recent JAMA study indicates that a popular remedy for LUTS might be worthless:
In conclusion, we found that saw palmetto extract used at up to 3 times the standard daily dose had no greater effect than placebo on improving lower urinary symptoms or other outcomes related to BPH.
Discussion
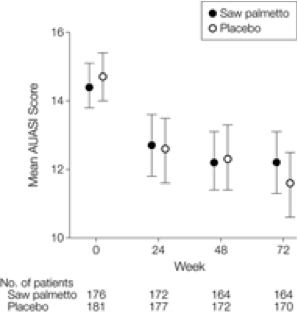
1. According to Science Daily, the JAMA “study was a double-blind randomized placebo-controlled clinical trial conducted at 11 North American clinical sites from June 2008 to October 2010. A cohort of 369 men aged 45 years or older participated.”
The group average change in AUASI score [a lower score is better] from baseline to 72 weeks between the saw palmetto and placebo groups was 0.79 points, favoring placebo. Saw palmetto was not more effective than placebo in reducing urinary symptoms for any of the secondary outcomes.
See the JAMA graph below for a more vivid overall description.
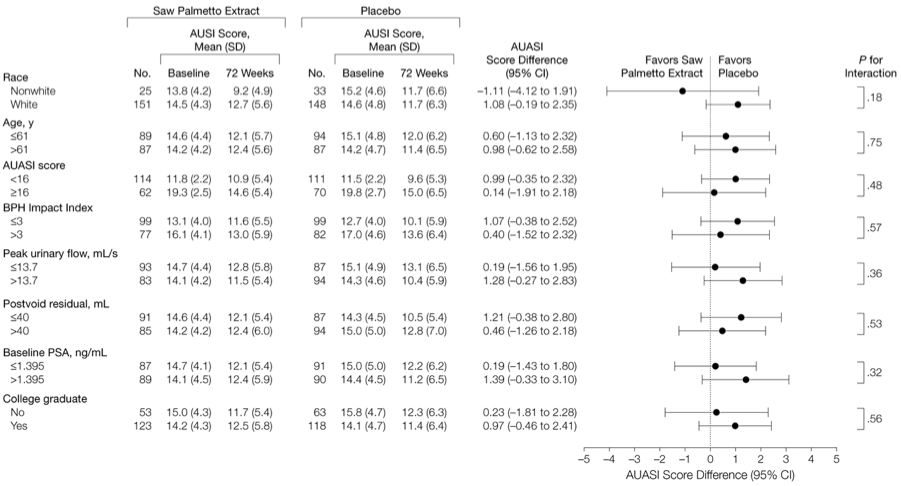
2. When the results are disaggregated, they appear thusly and the placebo almost always outperforms saw palmetto:
3. The JAMA article says “1-sided P = .91.” Why was a 1-sided hypothesis test done in place of a 2-sided test? And why is the p-value so ridiculously high?
4. The many clinical studies cited by the Saw Palmetto Trading Company seem to indicate that saw palmetto is effective in treating BPH yet the JAMA article concludes otherwise. Why might the JAMA article be more persuasive than the previous studies?
5. The following link What to ask about prostate cancer accompanied the recent NYT Magazine article Can cancer ever be ignored? (by Shannon Brownlee and Jeanne Lenzer, 5 October 2011). See also the following video from the website healthcrossroads.com, which gives a balanced assessment about the value of PSA testing. Do you think any of this will persuade urologists or their patients to change their behavior?
Submitted by Paul Alper
Breast cancer screening conundrum
Mammography is 'terribly imperfect,' though recommended
by Liz Szabo, USA Today, 9 October 2011
The article presents the following graphic juxtaposing benefits and risks from breast cancer screening:
http://i.usatoday.net/yourlife/graphics/2011/1010-breast-cancer-screening/breast-cancer.gif
Lisa Schwartz (co-author on the above analysis) is quoted in the article as saying "The cancers that screening is really best at finding are the 'good' ones that are never going to kill you anyway."
On the other hand, we read that "Many women feel pressure to get mammograms; it's seen as the "responsible" thing to do, Schwartz says. "Women don't want to (skip screening, then) feel like, 'Now I have this terrible cancer and it's all my fault.'"
Submitted by Paul Alper
Just plain lies
As statisticians, we are all too familiar with the famous dictum about lies, damned lies and statistics. A recent blog post by Andrew Gelman (27 Oct 2011) makes the important point that The #1 way to lie with statistics is . . . to just lie!
Gelman credits blogger Jay Livingstone for catching the following misleading report from pollster Doug Schoen. Writing in the Wall Street Journal (Polling the Occupy Wall Street crowd, 18 October 2011), Schoen had the following to say about the movement:
The protesters have a distinct ideology and are bound by a deep commitment to radical left-wing policies. On Oct. 10 and 11, Arielle Alter Confino, a senior researcher at my polling firm, interviewed nearly 200 protesters in New York's Zuccotti Park. Our findings probably represent the first systematic random sample of Occupy Wall Street opinion...
What binds a large majority of the protesters together—regardless of age, socioeconomic status or education—is a deep commitment to left-wing policies: opposition to free-market capitalism and support for radical redistribution of wealth, intense regulation of the private sector, and protectionist policies to keep American jobs from going overseas.
The WSJ article does not give the actual polling results. However, Schoen did share these with Azi Paybarah, who posted them here. Responses to the open-ended question "What would you like to see the Occupy Wall Street movement achieve?" are reproduced below:
- 35% Influence the Democratic Party the way the Tea Party has influenced the GOP
- 4% Radical redistribution of wealth
- 5% Overhaul of tax system: replace income tax with flat tax
- 7% Direct Democracy
- 9% Engage & mobilize Progressives
- 9% Promote a national conversation
- 11% Break the two-party duopoly
- 4% Dissolution of our representative democracy/capitalist system
- 4% Single payer health care
- 4% Pull out of Afghanistan immediately
- 8% Not sure
Compare the second bullet item to the WSJ description. When only 4% of your respondents mention radical redistribution of wealth, and you characterize this as a large majority, you are not "lying with statistics", you are just lying outright.
Submitted by Paul Alper
Discussion
- What does a statistician mean by a systematic random sample? How do you think Schoen's firm actually conducted the poll?
- How would go about conducting a poll of a crowd of protesters?
Waning support for the death penalty?
The death penalty’s de facto abolition
Editorial, New York Times, 14 October 2011
A recent Gallup poll finds support for the death penalty at 61%, which is the lowest level since 1972. That was the year when the Supreme Court ruled that existing state death penalty statutes were unconstitutional. The Court found that a lack of clear standards for imposing the death penalty had led to arbitrariness and potential discrimination. Statistical testimony indicated that minority defendants appeared to be disproportionately sentenced to death.
After 1976, thirty four states rewrote their laws to reinstitute the death penalty. However, the NYT editorial cites a variety of statistics from the Death Penalty Information Center indicating that the death penalty is still being applied arbitrarily:
Only one-seventh of the nation’s 3,147 counties have carried out an execution since 1976. Counties with one-eighth of the American population produce two-thirds of the sentences. As a result, the death penalty is the embodiment of arbitrariness. Texas, for example, in the past generation, has executed five times as many people as Virginia, the next closest state. But the penalty is used heavily in just four of Texas’s 254 counties.
According to Gallup, public support for the death penalty peaked at 80% in 1994, and has been declining since. On his blog (17 Oct 2011), Andrew Gelman presents a plot of the trend since 1955, broken out by race and sex. This graph is based on an unpublished paper (pdf here) applying hierarchical Bayesian models.
Over the summer, another NYT editorial The military and the death penalty (31 August 2011) argued that "that racial disparity is even greater in death penalty cases in the military system" than in the civilian system. In describing the civilian cases, the editorial repeats a mistaken interpretation that is often made in this context. We read that
A landmark study of state cases...in the 1980s showed that a death sentence often hinged not on the race of the defendant, but on the race of the victim. People accused of killing white victims were four times as likely to be sentenced to death as those accused of killing black victims.
In fact, the study alluded to had expressed its findings in terms of odd ratios: the odds of a death sentence when the victim was white victim were 4.3 times the odds when the victim was black. The mistake of interpreting odds ratios as multipliers for probabilities was described by Arnold Barnett out in a classic 1994 article, How numbers are tricking you. Following Barnett, imagine particularly violent murder where the chance of a death penalty when the victim is white would be 0.99. The "four times as likely language" suggests that if the victim were black, the chance of the death penalty drops to only 0.99/4.3 = 0.23. Note, however, a probability of 0.99 with a white victim corresponds to 99:1 odds. This is where the odds ratio properly applies: the odds with a black victim would be 23:1. But this corresponds to a 23/24 = 0.96 chance of a death sentence. While this is certainly smaller than 0.99, the reduction is nowhere near as dramatic as the language in the editorial would suggest.
Submitted by Bill Peterson
Remark
I had remembered that Barnett's article had the death penalty/odds ratio discussion. But re-reading it, I realized that I had forgotten another section entitled "The Skylab is falling," in which he contrasted the chance that some person on earth would be hit by a falling piece from the space station with the chance that YOU would be hit. See the recent Forsooth about satellite debris in Chance News 77. Some problems refuse to stay solved!