Chance News 77
Quotations
"Killing the publication [The Statistical Abstract of the United States] for the sake of a tiny saving would be a truly gratuitous step toward a dumbed-down country."
Submitted by Bill Peterson
"Incidentally, every criminal hacker I've ever heard of has been a male. I don't know if this is significant, but it's intriguing."
Submitted by Paul Alper
Forsooth
"The Rays have won 21 games in a row when scoring five runs or more."
This may be true, but it is quite a statistic nonetheless! In a related vein, see Seven statistical cliches used by baseball anounncers from Chance News #1.
Submitted by Peter Doyle
In Piece of falling satellite could hit you -- but it's not likely (Detroit Free Press, 11 September 2011) we read
Statistically, there's a 1 in 3,200 chance someone could be hit by one of the 26 objects...expected to crash into Earth's surface [in September].
The headline writer for the print edition of the newspaper created a Forsooth by rewriting this statistic in the secondary headline, beneath "NASA warns: Look out below!", as
There's a 1 in 3,200 chance a piece of satellite will hit you.
Submitted by Jerry Grossman
The Burlington [VT] Free Press, 13 September 2011, p B1, has a story with the headline:
"Irene's bill in Vermont could top half-billion dollars"
In the print edition, the story continued on a p. B3, with the secondary headline:
"COST: Irene repairs could top 500,000 dollars"
Submitted by Priscilla Bremser
What is the payoff for high tech education?
In Classroom of Future, Stagnant Scores by Matt Richtel, New York Times, September 3, 2011.
Technology has changed how we teach our children.
Amy Furman, a seventh-grade English teacher here, roams among 31 students sitting at their desks or in clumps on the floor. They’re studying Shakespeare’s “As You Like It” — but not in any traditional way. In this technology-centric classroom, students are bent over laptops, some blogging or building Facebook pages from the perspective of Shakespeare’s characters. One student compiles a song list from the Internet, picking a tune by the rapper Kanye West to express the emotions of Shakespeare’s lovelorn Silvius.
The class, and the Kyrene School District as a whole, offer what some see as a utopian vision of education’s future. Classrooms are decked out with laptops, big interactive screens and software that drills students on every basic subject. Under a ballot initiative approved in 2005, the district has invested roughly $33 million in such technologies.
These technology upgrades arebeing implemented in many other school districts. The problem is that all this investment in technology does not appear to have any pay off.
Since 2005, scores in reading and math have stagnated in Kyrene, even as statewide scores have risen. To be sure, test scores can go up or down for many reasons. But to many education experts, something is not adding up — here and across the country. In a nutshell: schools are spending billions on technology, even as they cut budgets and lay off teachers, with little proof that this approach is improving basic learning.
The backers of this new technology alternate between fighting
Some backers of this idea say standardized tests, the most widely used measure of student performance, don’t capture the breadth of skills that computers can help develop.
and apologizing
“The data is pretty weak. It’s very difficult when we’re pressed to come up with convincing data,” said Tom Vander Ark, the former executive director for education at the Bill and Melinda Gates Foundation and an investor in educational technology companies. When it comes to showing results, he said, “We better put up or shut up.”
and relying on intuition
“My gut is telling me we’ve had growth,” said David K. Schauer, the superintendent here. “But we have to have some measure that is valid, and we don’t have that.”
Questions
1. Why is it difficult to get valid data to measure the impact of technology upgrades?
2. Should technology upgrades wait until there is quantitative proof of its value?
Data science is hot
Data scientist: The hot new gig in tech
by Michal Lev-Ram, CNNMoney online, 6 September 2011
This is an online reprint of an article that appeared in Fortune magazine on 5 September. After decades of jokes about "lies, damned lies and statisics", recent years have seen statistics jobs listed on numerous lists of top employment opportunities. So as the semester begins, it's nice to be able share with students some stories about our new, higher profile.
The emerging positions have a variety of names. Last month the Wall Street Journal (4 August 2011) ran a story entitled Business schools plan leap into data, where we read:
Faced with an increasing stream of data from the Web and other electronic sources, many companies are seeking managers who can make sense of the numbers through the growing practice of data analytics, also known as business intelligence. Finding qualified candidates has proven difficult, but business schools hope to fill the talent gap.
Submitted by Bill Peterson, based on a post from R Bloggers.
Facial frivolity
“The NFL’s Best-Looking Team”
by Reed Albergotti, The Wall Street Journal, September 8, 2011
At the Journal's request, researchers at Ursinus College in Pennsylvania analyzed the facial structure of a sampling of 320 NFL starters (five offensive and five defensive players from each team). They also threw in two of the most photographed personalities on any team, the owner and the head coach.
The researchers programmed a computer to measure attractiveness with respect to facial symmetry. Their results gave first-place ranking to the one of the lowest performing teams, the Buffalo Bills (“99.495533373140” out of 100 possible points). And they ranked at the bottom a much more successful team, the Kansas City Chiefs (“94.609018741541”). The top and bottom player positions were, respectively, kicker and wide receiver. Apparently “average people” score in the “high 80s.”
The article includes the summary score (to 12 decimal places) for each team, as well as the names of the players, coaches and owners in the survey.[1]
A blogger[2] commented: “This article is proof that some people should not have computers and access to data.”
Submitted by Margaret Cibes
Comment
As further evidence in support of that last assertion, Paul Alper sent a link to the ARK CODE Home Page, where we read:
As a U.S. Coast Guard officer/military planner with Hebrew skills, I needed to know if Drosnin's predictions [from The Bible Code ] were valid; and suspected that a real Code would include the location of the Ark.
(You can find more discussion of Bible Codes in the Chance News archives here and here.)
Worst graph of the year
Andrew Gelman's blog awarded (Worst) graph of the year honors to the following:
http://community.middlebury.edu/~wpeterso/Chance_News/images/CN77_fbi_islam.png
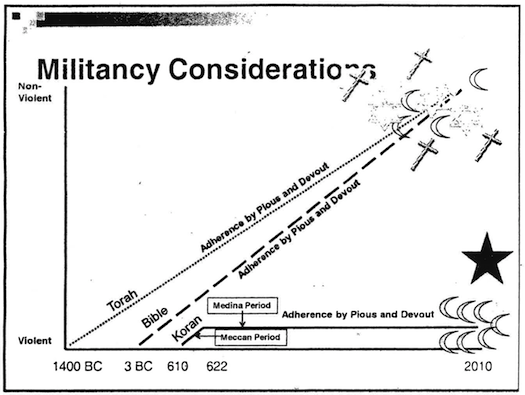
This graphic was reproduced in a Wired magazine article (14 September 2011), as part of a PowerPoint presentation that was supposedly shown at an FBI training program (with a disclaimer stating the the views expressed do not necessarily reflect the views of the US government!). The commentary on the blog is all worth reading. Andrew concludes with this: "Perhaps the same crew can arrange a presentation for the Army Corps of Engineers, discussing the techniques used in the parting of the Red Sea?"
Submitted by Paul Alper
More on satellite debris
Apparently the satellite Forsooth was not simply a headline editing issue. Priscilla Bremser wrote to say that it has now been discussed on the SIGMAA-QL discussion list, where one reader (Martha Smith) reported hearing on the radio that "The odds that someone will be hit by debris are 1 in 3200." Here is how the problem is diagnosed in that discussion:
It [the original headline] referred to "The probability of the event 'someone will be hit by debris'," rather than "The probability of the event, 'a randomly chosen person will be hit by debris'." But we often use the language "The probability that someone ..." with the latter meaning.
It is also noted that other news stories have been more careful with the distinction. For example, an NPR story said
NASA put the chances that somebody somewhere on Earth will get hurt at 1 in 3,200. But any one person's odds of being struck have been estimated at 1 in 21 trillion.