Chance News 74
June 6, 2011 to July 5, 2011
Quotations
"The government are very keen on amassing statistics. They collect them, add them, raise them to the nth power, take the cube root and prepare wonderful diagrams. But you must never forget that every one of these figures comes in the first instance from the village watchman, who just puts down what he damn pleases."
As quoted by Howard Wainer, in Picturing the Uncertain World Princeton University Press, 2009, p. 23. The above observation is by no means dated, as shown by the following exerpt from p. 24:
"The term curbstoning describes a practice that is widespread enough to warrant inclusion in the glossary of The 2000 Census: Interim Assessment, which defines it as 'The practice by which a census enumerator fabricates a questionnaire for a residence without actually visiting it.' "
Submitted by Paul Alper
"So when I hear scientists say, 'The data speak for themselves,' I cringe. Data never speak. And data generally and most often are politically and socially inflected."
As quoted in Q. and A.: Taking On Climate Skepticism as a Field of Study, Green Blog, New York Times, 9 April 2011
Submitted by Bill Peterson
“A cancer research agency that's part of the World Health Organization reported that it had classified cellphone usage as ‘possibly carcinogenic to humans.’ …. ’Possibly,’ of course, covers a wide range of outcomes. I could possibly win the Powerball jackpot Saturday and be living in Maui by midweek, but probably, I'll be back at my desk, checking with the debunkers at George Mason University about the next false alarm. …. The word ‘possible’ has become ‘the new gold standard of precautionary thinking,’ [a STATS editor] comments, "but it is by definition impossibly vague."
Cited in STATS in the News, GMU, June 27, 2011
Submitted by Margaret Cibes
Forsooth
"Is there one New Yorker in a hundred who knows what the morning line is? (It’s the track oddsmaker’s estimate of how the public will bet each horse in a race, expressed in probabilities like 3/1 or 7/2.)"
Belmont awaits its annual return to glory, New York Times, 9 June 2011
Submitted by Bill Peterson
"Did you hear about the statistician who took a bomb with him whenever he got on an airplane? He did this as a safeguard against terrorism, reasoning that although the chance is low that a terrorist will bring a bomb onto a particular airplane, the chance is really low that two people will bring bombs onto the same plane."
Submitted by Margaret Cibes
Note: Alas, this seems to have morphed over the years into a joke about statisticians! It appeared in John Allen Paulos' 1989 classic Innumeracy, as a take-off on the public's misconceptions about probability and coincidence.
“[A] recent peer-reviewed study[1] found that early-voting states received more federal dollars after a competitive election — so long as they supported the winning candidate.”
Submitted by Margaret Cibes at suggestion of James Greenwood
Overdiagnosed, overtreated
Obviously, the sun revolves around the earth, the harmonic series converges and the earth is flat. Likewise, the prevailing medical paradigm is: early screening leads to early intervention resulting in improved medical outcomes. Completely plausible and believed by most patients and medical practitioners alike. If you are one of the believers then you ought to read H. Gilbert Welch’s Overdiagnosed: Making People Sick In The Pursuit of Health (Beacon Press, 2011).
It has become increasingly evident with regard to prostate cancer or breast cancer that, “While it may seem that screening can only help you, it can also hurt you: it can lead you to being overdiagnosed and treated needlessly.” Consider a different cancer, one far less frequent: thyroid cancer. According to Welch, the ratio of prostate cancer deaths to diagnoses is 1 to 6 but the ratio for thyroid cancer is 1 to 20.
One possible explanation for this, as you will recall from similar issues with prostate cancer, is that we are really, really good at treating thyroid cancer. The other is less optimistic: that many of the diagnosed cancers didn’t need treatment in the first place.
Further, despite the “dramatic growth in the number of thyroid cancers found,” “The death rate for thyroid cancer is rock-solid stable.” He puts it boldly for thyroid cancer: “Here there is just a downside—a lot of diagnosis and no change in mortality…there is no discernible benefit.” This overtreatment results in the unnecessary removal of the thyroid gland and the need to take medication for the rest of the person’s life.
On page 64 is a time series graph that shows new thyroid cancer diagnoses and thyroid cancer deaths vs. time (1975 to 2005); new diagnoses rise inexorably with time while deaths are flatlined over the 30-year period. Two pages later there is virtually the same graph but now for melanoma and again the ratio of cancer deaths to diagnoses is high enough to speculate that “there is less an epidemic of melanoma than an epidemic of diagnoses.”
One reason for the general increase in overdiagnoses is the changing of the rules, the moving of the goalposts. Thresholds for diabetes, hypertension, hyperlipidemia and osteoporosis have been changed such that the disease prevalence has increased by 14%, 35%, 86% and 85%, respectively. “Whether or not” the cutoff changes were “a good thing for the individuals is a tough question. But there is no question about whether or not it was a good thing for business. These changes substantially increased the market for treatments—and the money to be made from them.”
As might be expected, the experts who set the cutoffs had financial relationships with the pharmaceutical industry which stood to gain many millions of new customers. However, “To be fair, many of these experts may be true believers…but the fact that there is so much money on the table may lead them to overestimate the benefits and harms of overdiagnosis.”
The publisher's webpage excerpts the Introduction to the book, and provides links to numerous reviews from current newspapers.
The author was interviewed on the radio show People's Pharmacy; the interview can be listened to here.
Discussion
1. A somewhat companion book for this topic is Shannon Brownlee’s Overtreated: Why Too Much Medicine Is Making Us Sicker and Poorer. Although published four years before Overdiagnosed, Welch makes no reference to her book.
2. HeathNewsReview.org is an excellent weekly website that deals critically with health and medical matters, especially of harms vs. benefits, relative risks vs. absolute risks.
3. Why would an overdiagnosis have health insurance consequences?
4. Welch often mentions the term, “incidentaloma.” Wikipedia says “In medicine, an incidentaloma is a tumor (-oma) found by coincidence (incidental) without clinical symptoms or suspicion. It is a common problem.” Why might an incidentaloma lead to overdiagnosis?
5. Lawyers and fear of a malpractice suit are discussed in the book. Why might they lead to overdiagnosis and overtreatment?
Submitted by Paul Alper
See also More Harm Than Good: What Your Doctor May Not Tell You about Common Treatments and Procedures, 2008. The authors are strong advocates for evidence-based medical decision-making.
Submitted by Margaret Cibes
The following graphic appeared in a 2009 New York Times article, Cancer Society, in shift, has concerns on screenings.
http://graphics8.nytimes.com/images/2009/10/21/health/1021-biz-cancergraphic/popup.jpg
The article quotes Dr. Otis Brawley, chief medical officer of the American Cancer Society: “We don’t want people to panic. But I’m admitting that American medicine has overpromised when it comes to screening. The advantages to screening have been exaggerated.”
See also Lung cancer screening may increase your risk of dying from Chance News 25.
Submitted by Paul Alper
Kidney cancer
A classic example of data maps is presented by Howard Wainer in Picturing the Uncertain World; it can be seen here. Many rural counties show up in the lowest decile for kidney cancer rates, which might suggest that climate or lifestyle have some benefit. But then it is seen that adjoining, similarly rural, counties turn up in the highest decile. Shown below is a map that accompanied Wainer's discussion of the example in an article entitled The Most Dangerous Equation (American Scientist May-June 2007 Volume 95, Number 3, p. 249).
http://www.americanscientist.org/Libraries/images/2007327141118_846.gif
The highest decile counties are shown in red, the lowest in green. What we are seeing the effect of variation in small samples: because the rural counties have so few people, having one case vs. no cases makes the difference between the being in the top vs. the bottom decile for standardized rates of kidney cancer!
Submitted by Paul Alper
Facts vs. beliefs
“How facts backfire: Researchers discover a surprising threat to democracy: our brains”
by Joe Keohane, boston.com, July 11, 2010
Political scientists have been researching people’s abilities to alter their uninformed opinions and/or beliefs when confronted with accurate information and concluded:
Facts don’t necessarily have the power to change our minds. In fact, quite the opposite.
Studies appear to indicate that when people with strong political views are shown corrected facts in news stories, “they rarely changed their minds.” In fact, “our beliefs can dictate the facts we choose to accept.” Add this to the unprecedented amount of information available today and the widespread “political ignorance of the American voter," and political scientists are concerned about the threat to rational voting choices by our citizenry.
A 2000 study, in particular, showed that, while only 3% of 1000 Illinois residents answered more than half of a series of questions about welfare correctly, more than half expressed confidence in their answers. Other studies have confirmed this relationship between knowledge and confidence in knowledge with respect to partisan issues. Accepting information that is consistent with our beliefs, rightly or wrongly, is called “motivated reasoning.”
The focus of this article is a more recent study study[2] of undergraduates at a Midwestern college in 2005-2006. In one experiment, participants first read news stories with a planted, provably false but widely believed, fact, and then read a correction. The result was that those who had believed the non-fact before reading the correction believed it even more strongly after reading the correction. This effect was stronger in self-identified conservatives than in self-identified liberals.
This article discusses several other studies on the potential effect of education on participants, and posits possible solutions to this problem.
Submitted by Margaret Cibes
Vietnam draft vulnerability vs. attitudes toward war
“Voting and the Vietnam Draft”, by Christopher Shea, The Wall Street Journal, June 11, 2011.
"Caught in the Draft: The Effects of Vietnam Draft Lottery Status on Political Attitudes", by Robert S. Erikson and Laura Stoker, American Political Science Review, February 2010.
Abstract of "Caught in the Draft: The Effects of Vietnam Draft Lottery Status on Political Attitudes", by Robert S. Erikson and Laura Stoker, American Political Science Review, May 2011.
Shea summarizes an AP report about a study of the relationship between 260 young men’s 1969 Vietnam draft lottery numbers and their attitudes toward war and politics, independent of their actual military service. The study involved interviews with male high-school graduates (class of ’65) in the 1960s, 1970s, and 1990s. Lottery numbers ranged from 1 to 366, where 1 corresponded to those with January 1 birthdays (highest priority for the draft) and 366 to those with December 31 birthdays (lowest priority).
Men with the lowest lottery number were about one point more dovish … - assuming similar demographic characteristics - than men with the highest lottery number.
The February 2010 paper includes details of the study. Caveat: Some of the relationships analyzed were not found to be statistically significant.
The abstract of the 2011 article states:
Males holding low lottery numbers became more antiwar, more liberal, and more Democratic in their voting compared to those whose high numbers protected them from the draft. They were also more likely than those with safe numbers to abandon the party identification that they had held as teenagers.
Submitted by Margaret Cibes
Bubble prints
“Bursting the Bubble”, by Christopher Shea, The Wall Street Journal, June 18, 2011.
"Bubble Trouble: Off-Line De-Anonymization of Bubble Forms", by Joseph A. Calandrino, William Clarkson, and Edward W. Felten (to be presented at the Usenix Security Symposium, August 2011).
Shea reports that researchers have found that pencil strokes such as those used on fill-in-the-bubble answer sheets are “distinctive” enough to identify the person who filled them in.
He describes an experiment in which researchers programmed a computer to analyze “the mark's center of mass, the variance of pencil-strokes from the bubble's radius and the depth of shading, as well as more mathematically advanced measures.”
The computer analyzed 92 student surveys, checking a dozen marks from each respondent. Then the researchers scrutinized eight marks from a randomly picked person. The computer identified its man or woman 51% of the time. The correct answer was among the computer's top three choices 75% of the time and was 92.4% of the time among the top 10.
The researchers state:
This bubble-based analysis can have either positive or negative implications depending on the application. Potential applications range from detection of cheating on standardized tests to attacks on the secrecy of election ballots.
Questions
1. How should a defense attorney respond to a prosecutor who relied on this study to bring a case of cheating against a test-taker or a voter (perhaps under a fraud statute)?
2. Suppose that, as the researchers state in their report, "on-line analysis has the potential to achieve even higher rates of accuracy." In that case, a defense attorney might be interested in false positive rates (probability of an incorrect match given a positive match result), which are usually very high, even for very accurate tests, when the expected incidence of some condition is very low. Do you believe that the false positive rate here would be high, even if the identification sensitivity and selectivity rates were improved to a level of 99%?
Submitted by Margaret Cibes
Decling sperm counts? Maybe not
In Update on Sperm, Data Show No Decline, Gina Kolata, The New York Times, June 6, 2011.
A meta-analysis published in 1992 showed a very scary trend. Sperm counts were dropping.
The idea that sperm counts were plummeting began with an alarming paper published in 1992 by a group of Danish researchers. Sperm counts, they reported, declined by 50 percent worldwide from 1938 to 1991, and the trend would continue, they said.
Even at the time, the study had its share of critics.
Many other researchers criticized the data’s quality, citing flaws like a lack of standardized methods of collecting semen, methodological issues in semen analysis, biases in the ways men were selected, and variations in the length of time men abstained from ejaculating before their semen was collected. The study, said Dolores Lamb, a fertility expert at Baylor College of Medicine and president-elect of the American Society of Reproductive Medicine, “was problematic and raised alarms in society without critical thinking about the caveats and weaknesses inherent in the data and its analysis.”
But it was hard to find good solid data to address this topic. But a new data set seems to be just what is needed to look at the trend in sperm counts. And it came from the same source as the original study.
Meanwhile, the same Danish group that got the debate started began a study that analyzed annual semen samples collected from 18-year-old men who were being examined for their fitness for the military — a requirement in Denmark. Over the past 15 years, a total of 5,000 men provided semen for analysis.
This study looked at a homogenous group of men and used uniform collection techniques. It covered a long enough time frame to have sufficient power to detect any important trends, which it did not find. But what was odd was how the data first appeared.
The research group’s current leader, Niels Jorgensen, sent the data to the Danish Ministry of Health, which helped pay for the study, and the ministry then posted the data on its Web site.
This bypassed the peer-review process, angering some scientists. A peer-review article and accompanying editorial did emerge eventually in Epidemiology.
Questions
1. Assuming a 50% decline in sperm counts from 1938 to 1991, how long would it take until the average man would be sterile. Discuss some of the assumptions in this calculation.
2. Should data collected using government funds be made available immediately, or should it be held back until a peer-reviewed publication appears with a credible analysis of the data.
Submitted by Steve Simon
Another aspect of sperm counts
See also “What’s That Ticking Sound? The Male Biological Clock”, by Jennifer Vanderbes, The Wall Street Journal, June 25, 2011
Researchers are finding correlations between paternal age and birth defects.
“[M]en have their own ticking biological clock.”
Submitted by Margaret Cibes
Credit rating companies rate your health
Keeping Score on How You Take Your Medicine by Tara Parker-Pope, The New York Times - Well, June 20, 2011.
Loan companies won't talk with you until they've checked your credit score with a credit rating company. Now your doctor might not talk with you until he/she has checked you out with the same credit rating company. It's not your ability to repay a loan that they are worried about. They want to know about adherence, your ability to take medicines regularly.
Which patients are likely to take their prescription medications correctly and which ones are likely to deviate from the plan? FICO, a company whose credit score is widely used to assess the credit worthiness of millions of consumers, is planning to answer that question. It has developed a new FICO Medication Adherence Score that it says can predict which patients are at highest risk for skipping or incorrectly using prescription medications.
Can you measure poor adherence the same sort of way that you measure poor payment history? Apparently so.
"We started thinking about how do consumers behave as patients," said Mark Greene, the chief executive of FICO, based in Minneapolis. "The problem, from a math standpoint, is not all that different from banking and other industries."
But this score won't be used to deny you health care treatment.
FICO officials say insurance companies and other health care groups will use the score to identify those patients who could benefit the most from follow-up phone calls, letters and e-mails to encourage proper use of medication.
And it won't require the credit score rating company to snoop into your private health records.
The FICO medication score is based on publicly available data, like home ownership and job status, and does not rely on a patient’s medical history or financial information to predict whether he or she will take medication as directed. So, like a credit rating, it can be compiled without a person’s knowledge or permission.
Questions
1. How good could an adherence score be if it did not look at your medical records?
2. Do companies have a right to compile information like this about you? What recourse would you have/should you have if the adherence score is incorrect?
Submitted by Steve Simon
Great summer read by Ariely
“Predictably Irrational: The Hidden Forces That Shape Our Decisions”
by Dan Ariely, 2008
Ariely is an MIT professor who works in the field of behavioral economics. In this NYT best-selling book, he describes many areas in which people act irrationally, over and over, in many areas of life:
We are really far less rational than standard economic theory assumes.
Ariely’s stories and experiments are many and varied – and fascinating. I’ve seen a few before in other sources, but all were extremely interesting.
The book is not written as an academic work, but in a conversational manner, and its readability would make it appropriate for anyone, especially a student interested in statistics. At the same time, his exposition includes many important details about each study (all were controlled studies), and states in a footnote that:
As a convention in this book, every time I mention that conditions are different from each other, it always a statistically different difference.
Here is an overview of the types of contents:
(a) examples of how our own personal feelings both affect our decisions and are, or can be, manipulated by folks who are aware of our feelings;
(b) descriptions of controlled experiments the author has performed with colleagues, which illustrate the examples;
(c) implications of this information for individual decision-making; and
(d) brief biographies of his colleagues, specific article citations for the experiments, and supplementary references.
Ariely suggests that interested readers go to his website[3] to read his blog, watch some of his podcasts, and sign up to participate in more studies. His website also contains a link to “Arming the Donkeys”, “a weekly audio podcast featuring informal one-on-one chats with researchers in social and natural sciences.” And he has a new book The Upside of Irrationality: The Unexpected Benefits of Defying Logic at Work and at Home, which I have not yet read.
See Chance News 34, “Perception can be everything”, for a post about a placebo-effect report that was co-authored by Ariely.
See also Chance News 75, "Discussion of Ariely", to read about some statistical weaknesses in this book.
Submitted by Margaret Cibes
Dead grandmother syndrome
The Dead Grandmother/Exam Syndrome”
by Mike Adams, Annals of Improbable Research, 1999
In this article (originally published in a 1990 issue of The Connecticut Review, a publication of CSU), biologist Adams reports that he collected data for over twenty years on what he claims is an serious problem for college instructors and/or their students:
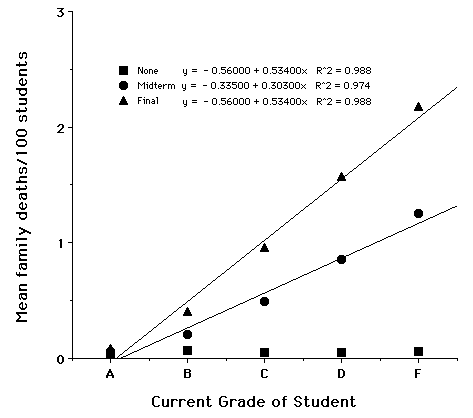
A student’s grandmother is far more likely to die suddenly just before the student takes an exam, than at any other time of year.
Adams provides cumulative data on his students' Family Death Rates (FDRs) as they relate to their grades on midterms, finals, and entire courses.
http://uploads.neatorama.com/wp-content/uploads/2011/04/figureone.png
He concludes:
Family members literally worry themselves to death over the outcome of their relatives’ performance[s] on each exam. …. Naturally, the worse the student’s record is, and the more important the exam, the more the family worries ….
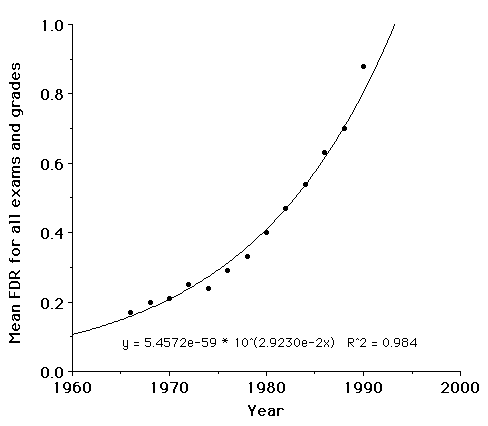
He also examined his students' FDRs over time:
http://uploads.neatorama.com/wp-content/uploads/2011/04/figuretwo.png
He concludes:
Examination of the numbers of deaths over the last two decades clearly showed that we are in a period of “death inflation.”
Questions
In his article, Adams states, “Figure 1 shows that the changes are strongly grade dependent, with correlation coefficients of 0.974 for mid-terms and 0.988 for finals.”
1. Can you see where he got his "correlation coefficients" from?
2. Would the actual correlation coeffients be so different as to make his conclusion invalid?
Submitted by Margaret Cibes
Vanity of vanities
“What Drives People to Take a Creative License?”
by Nancy Keates, The Wall Street Journal, June 23, 2011
Several states have implemented auctions for vanity license plates in an attempt to increase state revenues. In Texas car owners have been awarded, through auctions, a “PORCHE” plate for 7500 dollars, an “AMERICA” plate for 3000 dollars, and a “FERRARI” plate for the top price of 15,000 dollars. In Delaware, where people can transfer their plates to others, a family spent 675,000 dollars at a private auction for a “6” plate in 2008.
The U.S. state with the highest "vanity plate penetration rate" appears to be Virginia (16% of all vehicles), and the state with the lowest rate is Texas (less than 1%).
Keates asks, “Does that mean Virginia has more vain people than Texas?” And she answers her question by suggesting other possible reasons related to issues of self-esteem and prestige.
A University of Richmond researcher found in 2007 that “each dollar increase in the price of vanity plates decreased the percentage of plates personalized by about 0.1%" in 2002, reporting that figure as statistically significant.[4]
Questions
1. Keates questions whether Virginia’s higher rate of vanity plates (16%) than Texas’ rate (0.56%) means that Virginia has more vain people than Texas. From these rates alone, can you even conclude that Virginia has more vanity plates than Texas? What else would you need to know in order to draw that conclusion?
2. Do you think that “vanity,” “self-esteem,” and/or “prestige” are different characteristics?
3. The Richmond researcher found a statistically significant relationship between the price of vanity plates and the percentage of vanity plates. What else would you need to know in order to decide whether this relationship has actual, real-life significance with respect to state revenues?
4. What might be some implications of the Richmond researcher’s results, for a state using, or contemplating using, an auction to award vanity plates, for the purpose of increasing its revenue?
Submitted by Margaret Cibes
Another Numbers Guy
In addition to Carl Bialik, its “Numbers Guy,” The Wall Street Journal now has Jonathan Lehrer[5], who writes a column called “Head Case.” Lehrer is author of the book How We Decide (2010).
Here are links to a few of his columns:
“When We See What We Want”, June 25, 2011
“When We’re Cowed by the Crowd”, May 28, 2011
“Measurements That Mislead”, April 2, 2011
Submitted by Margaret Cibes
Golfers as sandbaggers
“Fighting Back Against Sandbaggers”
by John Paul Newport, The Wall Street Journal, July 2, 2011
A sandbagger is a golfer who uses “an inflated handicap to unfairly gain strokes in competition.”
Don Knuth, former Senior Director of the U.S. Golf Association Handicap Department, has a website[6], which contains a link to a “Dealing with Sandbagging” page. Knuth claims that a player with a “course handicap” in the range 13-21 will (1) outperform his/her handicap in one round in every 6 rounds, (2) exceed it by 3 strokes in one round in 43 rounds, (3) exceed it by 6 strokes in one round in 323 rounds.
The odds of a midrange player shooting eight strokes better than his course handicap are 1 in 1,138[7]. The odds of him doing that twice in 20 rounds … are 1 in 14,912. “Statistically speaking, it’s impossible,” Knuth said. …. Sam Snead had some sound advice for that circumstance: "You should never gamble with a stranger, and consider everyone a stranger until you've played with him at least a dozen times."
Questions
We do not have the raw frequency data here to verify most of Knuth’s odds figures. However, we might be able to determine whether his 1 in 14,912 “odds” figure is consistent with his 1 in 1,138 “odds” figure. For these questions, assume that (a) the 1 in 14,912 figure is based solely on the 1 in 1,138 figure, and not based on unavailable frequency data, (b) these are “probabilities,” not “odds,” and (3) game outcomes are independent.
1. Show that the probability that a midrange player will shoot eight strokes better than his course handicap in his first 2 rounds, but not in his next 18 rounds, is approximately 0.000 000 77.
2. Show that the probability that a midrange player will shoot eight strokes better than his course handicap in exactly 2 rounds out of 20 is approximately 0.000 144 41.
3. Does your answer to question 2 agree with Knuth’s stated “odds” of 1 in 14,912 -- whether he meant “odds” or “probabilities”? Can you suggest a reason for any discrepancy?
Submitted by Margaret Cibes
U.S. visa lottery
“A Losing Ticket in the American Lottery”
by Miriam Jordan and Alexandra Berzon, The Wall Street Journal, June 25, 2011
For 20 years the U.S. State Department, through its Diversity Visa Program, has been conducting an annual green-card lottery, wherein about 50,000 people a year are offered a chance to win permanent residence in the U.S. This program was started because the traditional immigration system, which is still in effect, was said to be too geographically restricted due to a priority given to family members of U.S. residents.
The lottery is free to enter, and winners pay $819 in fees after their selection. In the first year of online applications, almost 6 million entries were submitted. The article describes snafus in the selection process, which have caused many accepted candidates to be disappointed when their acceptances have been withdrawn.
The article provides this chart comparing lottery-system immigrants with traditional-system immigrants:
http://community.middlebury.edu/~wpeterso/Chance_News/images/CN74_visa.png
Submitted by Margaret Cibes