Chance News 71: Difference between revisions
| Line 144: | Line 144: | ||
In 2001, based on examination of 20,000 incidents from 25 years of FARC (Revolutionary Armed Forces of Columbia) attacks, researchers found that the number of attacks (frequency y) associated with the numbers of fatalities per attack (attack size x) were not distributed normally, but rather according to a decreasing power law curve. In 2005 they then examined Iraq casualty data and found an almost identical curve as that for Columbia. Since then they and other researchers have examined other insurgencies in other countries and have found curves to the powers of -2.38, -2.4, -2.5, -2.55, -2.44.<br> | In 2001, based on examination of 20,000 incidents from 25 years of FARC (Revolutionary Armed Forces of Columbia) attacks, researchers found that the number of attacks (frequency y) associated with the numbers of fatalities per attack (attack size x) were not distributed normally, but rather according to a decreasing power law curve. In 2005 they then examined Iraq casualty data and found an almost identical curve as that for Columbia. Since then they and other researchers have examined other insurgencies in other countries and have found curves to the powers of -2.38, -2.4, -2.5, -2.55, -2.44.<br> | ||
Curry describes the | Curry describes the power law curve as “a progression in which the value of a variable … is always ramped up or down by the same exponent, or power, as in: two to the power of 2 … equals four, three to the power of two … equals nine, for to the power of two … equals 16, and so on.” He goes on to state: | ||
<blockquote>Although truly massive power-law events – like the Great Depression or killer storms – are drastically less common than smaller disruptions, they still occur. In the normal distribution of a bell curve, you never get such extremes, but the pattern underlying the power curve enables a few rare events of extraordinary magnitude.</blockquote> | <blockquote>Although truly massive power-law events – like the Great Depression or killer storms – are drastically less common than smaller disruptions, they still occur. In the normal distribution of a bell curve, you never get such extremes, but the pattern underlying the power curve enables a few rare events of extraordinary magnitude.</blockquote> | ||
Curry concludes that awareness of this distribution may help in strategic planning for a nation’s defense, in that a country might anticipate preparing for numerous less extreme events, as well as for one enormous disaster, because insurgent activity, by its nature lacking a central command structure, might be expected to present such challenges.<br> | Curry concludes that awareness of this distribution may help in strategic planning for a nation’s defense, in that a country might anticipate preparing for numerous less extreme events, as well as for one enormous disaster, because insurgent activity, by its nature lacking a central command structure, might be expected to present such challenges.<br> | ||
Revision as of 13:14, 4 March 2011
Quotations
"Regression, it seems has a particular ability to reduce otherwise emotionally healthy adults to an infantile state, blubbing hysterically and looking for someone's hand to hold. My guess is that this suits most statisticians just fine--a textbook on regression might look like a bunch of formulas to you; to statisticians like me, it 450 pages of job security."
"It is an odd feeling when you love what you do and everyone else seems to hate it. I get to peer into lists of numbers and tease out knowledge that can help people live longer, healthier lives. But if I tell friends I get a kick out of statistics, they inch away as if I have a communicable disease."
Submitted by Paul Alper
Forsooth
When did they start doing factoids?
12%: The percentage higher for searches of the word "guacamole" in Wisconsin than in Pennsylvania.
5%: The percentage higher for "baba ganoush" searches in Pennsylvania than in Wisconsin.
Submitted by Paul Alper
Getting what you pay for in college
Flurry of Data as Rules Near for Commercial Colleges Tamar Lewin, The New York Times, February 4, 2011.
It costs a lot of money to go to college. If you are able to get a better job as a result, that is money well invested. But that is not always the case, and it may be that commercial colleges have more problems with this.
On Thursday, the department issued new data showing that many commercial colleges leave large numbers of their graduates unable to pay back their loans. The data — covering all institutions of higher education — found that among students whose loans came due in 2008, 25 percent of those who attended commercial colleges defaulted within three years, compared with 10.8 percent at public institutions and 7.6 percent at private nonprofit colleges and universities.
That's not a fair comparison, according to some.
"Our schools are primarily educating working adults and lower income students, which is not true of traditional higher education," said Harris Miller, president of the Association of Private Sector Colleges and Universities. "My expectation is that if you compared schools with our demographics, they would have similar rates, and I don’t understand why the Department of Education can’t break it down that way."
There will soon be penalties for colleges with poor data on loan repayment performance.
Starting next year, colleges that have default rates greater than 30 percent for three consecutive years will, as of 2014, lose their eligibility for federal student aid.
There are differing opinions on whether this is a good thing.
The commercial colleges say the rule, as proposed, would cut off education opportunities for low-income and minority students with too few educational options. But consumer advocacy groups say that it would eliminate only the programs whose students have the highest loan-default rates, and, in the process, help protect both students and taxpayers from programs that take in millions of dollars of federal aid but leave students mired in debt.
Questions
1. Should loan default rates be adjusted for the demographics of the student population?
2. What sort of data, other than loan default rates could be collected to measure how effective colleges are.
Gladwell on college ranks
The order of things: What college rankings really tell us
by Malcolm Gladwell, New Yorker, 14 February 2011
To be continued...
Submitted by Bill Peterson, based on a suggestion from Priscilla Bremser
Bayesians and Bem's ESP paper
Bayesian statisticians have many criticisms of Bem’s paper. Perhaps the major one is Bem’s reliance on low p-value to show that ESP exists. In the Bayesian world, unlike the frequentist one, p-value is viewed as a flawed metric for testing hypotheses. The following is a hypothetical example from Freeman:
| Number of Patients Receiving A and B |
Numbers Preferring A:B |
% Preferring A |
two-sided p-value |
| 20 | 15: 5 | 75.00 | 0.04 |
| 200 | 115: 86 | 57.50 | 0.04 |
| 2000 | 1046: 954 | 52.30 | 0.04 |
| 2000000 | 1001445: 998555 | 50.07 | 0.04 |
The p-value is numerically the same regardless of sample size; in particular, the last row is evidence that treatment A and B are equivalent despite the continuing low p-value. To bring things back to Bem’s paper, assume that treatment A has ESP and B does not.
Here is another example known as Lindley’s paradox which demonstrates that p-value is a flawed metric; such analysis was first published about 80 years ago. Although this example involves 98,451 births of boys and girls, it could just as well deal with ESP successes and failures.
Let's imagine a certain town where 49,581 boys and 48,870 girls have been born over a certain time period. The observed proportion (x) of male births is thus 49,581/98,451 = 0.5036. We are interested in testing whether the true proportion (θ) is 0.5. That is, our null hypothesis is H0: θ = 0.5 and the alternative is H1: θ ≠ 0.5.
Because the sample size is very large, the normal approximation to the binomial holds; the mean proportion under the null is .5 and the variance is σ2 ≈ x(1−x)/n, or (.5036)(.4964)/98,451.
Using the normal approximation above, the upper tail probability is the one-sided p-value
http://community.middlebury.edu/~wpeterso/Chance_News/images/CN71_Bem1.png
By symmetry, the two-sided p-value is double that, .0234 which indicates statistical significance.
However, if we assume we have no reason to believe that the proportion of male births should be different from 0.5, so we assign prior probabilities P(θ = 0.5) = 0.5 and P(θ ≠ 0.5) = 0.5, the latter uniformly distributed between 0 and 1. The prior distribution is thus a mixture of point mass 0.5 and a uniform distribution U(0,1) . This leads to
http://community.middlebury.edu/~wpeterso/Chance_News/images/CN71_Bem2.png
This is strong evidence in favor of H0: θ = 0.5. Consequently, despite the low p-value, we have a high probability the null is correct.
If p-value is so flawed, the natural question is: why is it so ubiquitous? One answer is that it is a mathematical procedure which is much easier to perform; indeed, before the availability of stats packages, students ignorant of calculus could readily use the standard normal table to carry out the frequentist calculation. Further, the pesky (but fundamentally important to Bayesians) issue of prior probabilities is sidestepped entirely. For decades the Bayesian triumph has been predicted but thus far, the U.S. remains a frequentist stronghold and p-values galore are published.
But there is another issue regarding Bem’s paper which is outside of the domain of statistics. Why do so many people passionately believe in ESP even though there has never been any credible evidence for it outside of a low p-value? Perhaps the answer lies in a weird perversion of the notion of democratic opinion. If ESP exists then physical laws, the specialty of the scientifically and mathematically educated, no longer hold and everyone has an equal say. Beauty may lie in the eyes of the beholder, but it is incontestable that the speed of light is exactly 299,792,458 meters per second, the harmonic series diverges and the planet on which we reside is considerably older than a few thousand years. Such items are not up for a vote and should not be subject to the ballot box of public estimation.
Submitted by Paul Alper
Car Talk tackles a probability classic
Puzzler: Three slips of paper
Car Talk, NPR, week of 12 February 2011
Below is an exerpt from a recent Puzzler segment on Car Talk (but it is even more entertaining to listen to the actual audio).
RAY: This is from Norm Leyden from Franktown, Colorado. The date on it is 1974--I'm a little behind.
Three different numbers are chosen at random, and one is written on each of three slips of paper. The slips are then placed face down on the table. The objective is to choose the slip upon which is written the largest number.
Here are the rules: You can turn over any slip of paper and look at the amount written on it. If for any reason you think this is the largest, you're done; you keep it. Otherwise you discard it and turn over a second slip.
Again, if you think this is the one with the biggest number, you keep that one and the game is over. If you don't, you discard that one too.
TOM: And you're stuck with the third. I get it.
RAY: The chance of getting the highest number is one in three. Or is it? Is there a strategy by which you can improve the odds?
After puzzling for yourself, you can read or listen to Tom and Ray's explanation.
Ray may have been joking about the date, but many readers will recognize that this is a classic problem, related to the Secretary Problem and the Two-Envelope Paradox. All of this was reviewed in a 1989 paper by Tom Ferguson, entitled Who solved the secretary problem? (Statistical Science Volume 4, Number 3, 282-289). Section 6 there discusses the Game of Googol, which is attributed to a 1960 Scientific American column by Martin Gardner. Googol sounds like the three slips of paper puzzle, but Ferguson points out that it is actually a two-person game, involving some subtlety about how the numbers came to be written on the slips.
This Puzzler has actually appeared before on Car Talk, and you can read more discussion from 2001 in the Chance News archives.
Submitted by Bill Peterson, based on a suggestion from Domenico Rosa
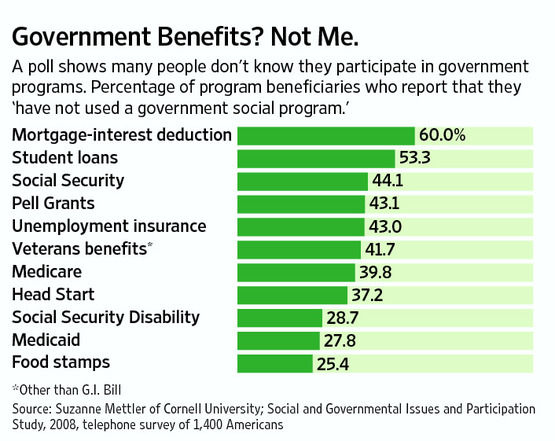
Do you get government benefits?
In a 2010 paper in the journal Perspectives on Politics, Suzanne Mettler of Cornell University presents survey data indicating that Americans widely misinterpret the extent to which they benefit from government programs. The following graphic, reproduced from the Wall Street Journal, says it all:
http://community.middlebury.edu/~wpeterso/Chance_News/images/CN71_WSJ_benefits.jpg
Submitted by Paul Alper
Terrorist attacks and power law distributions
“Mathematics of Terror”
by Andrew Curry, Discover Magazine, July/August 2010
In 2001, based on examination of 20,000 incidents from 25 years of FARC (Revolutionary Armed Forces of Columbia) attacks, researchers found that the number of attacks (frequency y) associated with the numbers of fatalities per attack (attack size x) were not distributed normally, but rather according to a decreasing power law curve. In 2005 they then examined Iraq casualty data and found an almost identical curve as that for Columbia. Since then they and other researchers have examined other insurgencies in other countries and have found curves to the powers of -2.38, -2.4, -2.5, -2.55, -2.44.
Curry describes the power law curve as “a progression in which the value of a variable … is always ramped up or down by the same exponent, or power, as in: two to the power of 2 … equals four, three to the power of two … equals nine, for to the power of two … equals 16, and so on.” He goes on to state:
Although truly massive power-law events – like the Great Depression or killer storms – are drastically less common than smaller disruptions, they still occur. In the normal distribution of a bell curve, you never get such extremes, but the pattern underlying the power curve enables a few rare events of extraordinary magnitude.
Curry concludes that awareness of this distribution may help in strategic planning for a nation’s defense, in that a country might anticipate preparing for numerous less extreme events, as well as for one enormous disaster, because insurgent activity, by its nature lacking a central command structure, might be expected to present such challenges.
See a 7-minute TEDTalk video[1] by a physicist who presents a generic power law equation for predicting the probability of an attack of any size.
See also “The Mathematics of War” for more details about this research.
Discussion
1. Consider the general power law equation shown in the TEDTalk: P(x) = C * x ^ (-alpha), which is said to describe the probability of a terrorist attack in terms of x, the number of fatalities, or size of the attack.
(a) What is the value of alpha for an equation of power -2.5?
(b) Sketch a graph of P(x) for a power of -2.5.
(c) Can you describe power law behavior in this terrorist case in a clearer mathematical way than "the value of a variable" being "ramped up or down by the same exponent"? How about using the term "variation"?
2. The TEDTalk shows graphs of various sets of terrorist-attack data with their associated regression lines.
(a) The lines shown are decreasing. Why do you think that the author refers to the slope as alpha, which is a positive number?
(b) Explain the relationship between these regression lines and their associated "power law" curves.
3. What additional information would help you to have some level of confidence in drawing any statistical inference about the distribution terrorist attacks with respect to their fatalities and frequencies?
4. Do you agree with the Discover author that "you never get such extremes” in a normal distribution?
Submitted by Margaret Cibes