Chance News 68: Difference between revisions
m (→Discussion) |
mNo edit summary |
||
| (78 intermediate revisions by 7 users not shown) | |||
| Line 1: | Line 1: | ||
November 1, 2010 to November 28, 2010 | |||
==Quotations== | ==Quotations== | ||
<blockquote>"If you're a politician, admitting you're wrong is a weakness, but if you're an engineer, you essentially want to be wrong half the time. If you do experiments and you're always right, then you aren't getting enough information out of those experiments. You want your experiment to be like the flip of a coin: You have no idea if it is going to come up heads or tails. You want to not know what the results are going to be." Peter Norvig, as quoted at [http://www.slate.com/blogs/blogs/thewrongstuff/archive/2010/08/03/error-message-google-research-director-peter-norvig-on-being-wrong.aspx Slate Magazine]. Submitted by Steve Simon.</blockquote> | <blockquote>"If you're a politician, admitting you're wrong is a weakness, but if you're an engineer, you essentially want to be wrong half the time. If you do experiments and you're always right, then you aren't getting enough information out of those experiments. You want your experiment to be like the flip of a coin: You have no idea if it is going to come up heads or tails. You want to not know what the results are going to be." | ||
<div align=right> Peter Norvig, as quoted at [http://www.slate.com/blogs/blogs/thewrongstuff/archive/2010/08/03/error-message-google-research-director-peter-norvig-on-being-wrong.aspx Slate Magazine].</div> | |||
Submitted by Steve Simon.</blockquote> | |||
----- | |||
Two quotes from Sir Francis Galton[http://www-history.mcs.st-and.ac.uk/Quotations/Galton.html]: | |||
<blockquote> “ I know of scarcely anything so apt to impress the imagination as the wonderful form of cosmic order expressed by the 'Law of Frequency of Error.' The law would have been personified by the Greeks and deified, if they had known of it. It reigns with serenity and in complete self-effacement, amidst the wildest confusion. The huger the mob, and the greater the apparent anarchy, the more perfect is its sway. It is the supreme law of Unreason. Whenever a large sample of chaotic elements are taken in hand and marshaled in the order of their magnitude, an unsuspected and most beautiful form of regularity proves to have been latent all along.”<br> | |||
“[Statistics are] the only tools by which an opening may be cut through the formidable thicket of difficulties that bars the path of those who pursue the Science of Man.”</blockquote> | |||
Submitted by Margaret Cibes | |||
==Forsooth== | ==Forsooth== | ||
| Line 7: | Line 20: | ||
<blockquote>”One can't really say anything meaningful about probability without actual data.”</blockquote> | <blockquote>”One can't really say anything meaningful about probability without actual data.”</blockquote> | ||
Submitted by Margaret Cibes | Submitted by Margaret Cibes | ||
----- | |||
In Time Magazine's print article "Marriage: What's It Good For?" (November 29, 2010) a sociologist is reported to have said | |||
<blockquote>"About 21% of American Children will see at least two live-in partners of their mothers by the time they're 15. And an additional 8% will see three or more."</blockquote> | |||
The article is available online as "Who Needs Marriage? A Changing Institution"[http://www.time.com/time/nation/article/0,8599,2031962,00.html] | |||
Submitted by Chris Andrews | |||
----- | ----- | ||
| Line 45: | Line 67: | ||
Submitted by Margaret Cibes | Submitted by Margaret Cibes | ||
== | ===Comments=== | ||
[http:// | A reasonable explanation for the probability confusion alluded to in <br> | ||
by | a.) Linda is a bank teller.<br> | ||
b.) Linda is a bank teller and is active in the feminist movement.<br> | |||
is that the language of logic and the language of English are not identical. For example, "Or" in logic means either X or Y or both, | |||
whereas "or" in English usually means the exclusive "Or" in logic, | |||
either X or Y but not both. | |||
When it comes to "and," the reader, when not misreading the "and" for "or," tends to substitute "who," so instead of | |||
X and Y, | |||
the reader is really considering | |||
X|Y | |||
which, depending on the reader's view of feminists and bank tellers, may or may not lead to the belief that (b) is more likely than (a). | |||
Submitted by Paul Alper | |||
==Facebook data on relationship breakups== | |||
[http://bits.blogs.nytimes.com/2010/11/03/using-facebook-updates-to-chronicle-breakups Using Facebook Updates to Chronicle Breakups], Nick Bilton, The New York Times Bits Blog, November 3, 2010. | |||
David McCandless has a hobby that many would find odd, but perhaps not too odd to readers of Chance News. | |||
<blockquote>David McCandless, a London-based author, writer and designer, is constantly playing with data sets available online and translating heaps of code into well-designed visual stories. Some of Mr. McCandless’s notable projects include visualizing the billions of dollars spent by people and governments around the world and visually explaining the different views of United States politicians, divided by their political predilection.</blockquote> | |||
Facebook, a social network site, has data on relationship status: single, in a relationship, married, it's complicated, etc. With the help of Lee Byron of Facebook, he produced the following graph on breakups by looking at changes in relationship status. | |||
http://graphics8.nytimes.com/images/2010/11/03/technology/bits-breakupfbook/bits-breakupfbook-blogSpan.jpg | |||
The repeated peaks are Mondays, a day at higher risk of breakups. The general findings are that | |||
<blockquote>most breakups occur three times in the year — in the weeks leading up to spring breaks, right before the start of the summer holidays and a couple of weeks before Christmas.</blockquote> | |||
===Questions=== | |||
1. Changing one's status in Facebook is a surrogate measure of the actual ending of a relationship. What limitations does this produce in this data set? | |||
2. Mr. McCandless claims that "people tend to break up with their significant others on Mondays, presumably after a weekend grapple." Is there an alternate explanation for the spike of breakups on Monday? | |||
Submitted by Steve Simon | |||
==National polling 2010== | |||
[http://www.huffingtonpost.com/2010/11/03/how-did-the-polls-do_n_778216.html “How Did The Polls Do?”]<br> | |||
by Mark Blumenthal, <i>HUFFPOST POLLSTER</i>, November 3, 2010<br> | |||
Blumenthal discusses the 2010 pre-election polls: | |||
<blockquote>On average, the final statewide pre-election polls once again provided a largely unbiased measurement of the outcomes of most races, Congressional District polling had a slight Democratic skew, national polls that sampled both landline and cell phones measured national Congressional vote preference more accurately than those that sampled only landline phones and the venerable Gallup Poll took one on the chin. ...<br> | |||
[I]f we factor out the undecided and calculate the Republican percentage of the two-party vote for each survey, most capture the likely final result (53%) within their respective margins of error .... The most prominent exception is the Gallup Poll. The Republican share of the two-party vote predicted by their survey (58%) will likely miss the actual result by five percentage points, falling just outside the expected range of variation (55% to 61%). Gallup's error on the margin will likely be its biggest since it started asking the generic vote question 60 years ago.</blockquote> | |||
http://images.huffingtonpost.com/2010-11-03-Blumenthal-Generic2Party1103.png | |||
Submitted by Margaret Cibes | |||
Gallup's error on the margin will likely be its biggest since it started asking the generic vote question 60 years ago. | |||
==Nevada polling 2010== | |||
[http://www.huffingtonpost.com/2010/11/05/not-all-polls-were-wrong-_n_779705.html?view=screen “Not All Polls Were Wrong In Nevada”]<br> | |||
By Mark Blumenthal, <i>HUFFPOST POLLSTER</i>, November 6, 2010<br> | |||
<blockquote>While <i>public</i> media polls in late October consistently gave a slight advantage to Republican Senate challenger Sharron Angle, the <i>internal campaign</i> polls gave Democrat Harry Reid the edge and campaign pollsters on both sides attribute the difference to a combination of greater care in modeling the demographics of the electorate, more persistence in reaching all sampled voters and the added value of registered voter lists. [contributor's emphasis]</blockquote> | |||
Candidate pollsters also attributed their successes to maintaining a <i>constant</i> model of the distribution of voters (by age, gender, race, region) across the surveys, having available rich data sets of past voter behavior, insisting on multiple callbacks to reach pre-identified but unavailable voters instead of relying on random-digit dialing or settling for phone answerers, and using hand-dialed cell phone numbers despite the additional work required. (Random-digit dialing to cell phones is banned by federal regulation.)<br> | |||
===Discussion=== | |||
1. Explain and/or comment on the following statement by the author: | |||
<blockquote>While none of the margins on any one poll was large enough to attain statistical significance, the consistency of the results demonstrates that Angle's advantages did not occur by chance alone.</blockquote> | |||
2. Do you agree with this statement by the author? | |||
<blockquote>Our final "trend estimate" gave Angle a nearly three-point lead (48.8% to 46.0%) -- enough to classify the race as "lean Republican."</blockquote> | |||
Submitted by Margaret Cibes | |||
==Galton board video== | |||
[http://www.youtube.com/watch?v=AUSKTk9ENzg “Probability Machine”]<br> | |||
This is a nice YouTube video showing how the action of beads falling through an assortment of pins resembles the behavior of 5,000-6,000 monthly returns of the IFA Index Portfolio 100 over 50 years (through 2008).<br> | |||
There are three parts to the machine: (a) a fixed, drawn bell curve superimposed on glass over (b) a physical bar chart of thousands of beads representing the last 50 years of monthly average returns, and (c) a physical device randomly dropping beads through pins above the bar chart. A voiceover narrates the action of the falling beads, which is described as random.<br> | |||
===Discussion=== | ===Discussion=== | ||
Comment on the following (spelling-edited) blogs[http://www.youtube.com/watch?v=AUSKTk9ENzg].<br> | |||
1. “How is it random if all the beads are funneled into the center already. If a bead doesn’t start towards the right side, it’s never going to reach the right side.”<br> | |||
2. “Random would be an even distribution across the board. Random implies NO PATTERN …but this is clearly a pattern.”<br> | |||
Submitted by Margaret Cibes | |||
==Remarkable birthday pattern, or not?== | |||
[http://www.usatoday.com/yourlife/parenting-family/babies/2010-10-14-Birthday14_ST_N.htm “Mom’s babies born on 8-8-08, 9-9-09, 10-10-10”]<br> | |||
by Elizabeth Weise, USA TODAY, October 14, 2010<br> | |||
The article quotes a University of Oregon biostatistician: | |||
a | <blockquote>While the dates might seem “incredibly rare,” they're really not. Such a lineup can only happen in the first 12 years of the century and at least 10 months apart. …. Given that the first birth occurred in that window, the probability is not as astronomical as you might be compelled to think.</blockquote> | ||
And a Berkeley statistician states: | |||
<blockquote>[I]t's not that high a number at all. …. The 'chance' you get depends on the assumptions you make. …. One set of assumptions gives a chance of about 1 in 50 million. More realistic assumptions — including allowing at least 11 months between births — increases it to about 1 in 2,500. Since thousands of women in the United States had kids in 2008, 2009 and 2010, this suddenly seems a little less extraordinary.</blockquote> | |||
===Questions=== | |||
1. Estimate the probability of these three birthdays, based on the Oregon professor’s statement. What other assumption(s), if any, did you need?<br> | |||
2. Can you confirm the Berkeley statistician’s figure of 1 in 2,500, based on his "more realitic" assumption?<br> | |||
3. How might the Berkeley statistician have arrived at the 1 in 50 million figure? What assumption(s) did you need?<br> | |||
Submitted by Margaret Cibes | Submitted by Margaret Cibes | ||
==Walking and dementia== | |||
As per usual, eye-popping headlines in the press and on the web can be misleading: | |||
<UL> | |||
<li>[http://www.msnbc.msn.com/id/39657391/ns/health-alzheimer%27s_disease MSNBC:] “One way to ward off Alzheimer's: Take a hike” | |||
<li>[http://abcnews.go.com/Technology/wireStory?id=11873093 ABC News:] “Walking May Keep Brain From Shrinking in Old Age” | |||
<li>[http://punjabnewsline.com/content/walking-helps-retain-memory-old-age/24896 Punjab Newsline:] “Walking helps retain memory in old age” | |||
<li>[http://www.oregonlive.com/health/index.ssf/2010/10/forget_thinner_thighs_new_stud.html Oregon Live:] “Prime of life: Forget thinner thighs, new study shows walking protects brain size, saves memory” | |||
<li>[http://www.independent.co.uk/life-style/health-and-families/walking-can-save-your-memory-2120968.html Independent:] “Walking can save your memory” | |||
<li>[http://www.thirdage.com/news/alzheimer%E2%80%99s-disease-can-be-offset-walking_10-15-2010 Thirdage:] “Alzheimer’s Disease Can be Offset by Walking” | |||
</UL> | |||
The research article on which this news coverage is based--Erickson, et al, “Physical activity predicts gray matter volume in late adulthood: The Cardiovascular Health Study”, ''Neurology'', first published on October 13, 2010--has more modest proclamations. | |||
<blockquote> | |||
We cannot conclude a causal association between PA [physical activity] and GM [gray matter] volume. | |||
</blockquote> | |||
<blockquote> | |||
…given the observational nature of the study, we are unable to conclude that PA causes greater GM volume. | |||
</blockquote> | |||
<blockquote> | |||
Greater amounts of walking are associated with greater gray matter volume, which is in turn associated with a reduced risk of cognitive impairment. | |||
</blockquote> | |||
The study began in 1989-1990 with 1479 elderly subjects who “were free of dementia and mild cognitive impairment (MCI).” These subjects had their physical activity assessed at that time. In the nine years of follow-up, MRI’s were performed; this resulted in “299 cognitively normal subjects.” After four further years of follow-up, “183 remained cognitively normal in 2002-03” and “116 diagnosed MCI or dementia in 2002-03.” The authors chose to disaggregate the 299 into four groups depending on the number of blocks walked per week, 0-12, 13-24, 25-70 and 72-300 with 72 blocks being equated roughly to between 6 and 9 miles. The study claims that the last group had less gray matter shrinkage than any of the other three with no significant difference among the others. | |||
'''Discussion'''<br> | |||
1. The data for the number of blocks walked per week were obtained by asking the participants. Why is this a problem?<br> | |||
2. Why was tennis rejected as a measure of physical activity?<br> | |||
3. The underlying belief is that walking has an effect on brain health. Defend the notion that brain health has an effect on the desire to walk. The authors put it this way: “there remains a possibility that reduced amounts of walking is a result of ill health and that ill health leads to both reduced amounts of walking and GM volume loss.”<br> | |||
4. The original data were obtained in 1989-1990 and the final data occurred in 2002-03; the paper has ten authors and was published in 2010. What does this say about the difficulties of studying humans as opposed to fruit flies? <br> | |||
5. According to [http://www.science20.com/news_articles/walking_6_miles_week_may_preserve_memory_old_age Science 2.0:] “The researchers found that those who walked the most cut their risk of developing memory problems in half.” Why is this “risk” a relative risk and not an absolute risk?<br> | |||
6. The study does not show the percentage of cognitive impairment in each of the four walking categories. Why would this be helpful?<br> | |||
7. The statement found in the Conclusion, | |||
"Greater amounts of walking are associated with greater gray matter volume, which is in turn associated with a reduced risk of cognitive impairment" | |||
hints, via the concept of transitivity, that greater amounts of walking is associated with a reduced risk of cognitive impairment. That is, if A is related to B and B is related to C, then A is related to C. However, see [http://www.jstor.org/pss/2685695 Langford, et. al.] for a discussion of why this is not true in general. In particular, here is one of their counterexamples: | |||
<center> | |||
{| border="1" style="text-align:center" cellpadding="3" | |||
! X !! Y !! Z | |||
|- | |||
|4 || 201 || 15 | |||
|- | |||
| 6 || 165 || 30 | |||
|- | |||
| 1 || 145 || 28 | |||
|- | |||
| 1 || 150 || 41 | |||
|- | |||
| 0 || 160 || 18 | |||
|- | |||
|2 || 113 || 5 | |||
|- | |||
|5 || 140 || 7 | |||
|- | |||
|4 || 147 || 16 | |||
|- | |||
|0 || 83 || 15 | |||
|- | |||
|0 || 108 || 16 | |||
|} | |||
</center> | |||
Use a stats package to show that even though the correlation between X and Y is positive, and the correlation between Y and Z is positive, but the correlation between X and Z is negative. | |||
Submitted by Paul Alper | |||
==Crowd estimates== | |||
[http://voices.washingtonpost.com/ombudsman-blog/2010/11/crowd_counts_when_the_post_did.html Crowd counts: When The Post did it right]<br> | |||
by Andy Alexander, ''Washington Post'', Ombudsman Blog, November 10, 2010 | |||
Recent months have seen two rallies on the National Mall by media personalities: the "Restoring Honor" rally by Glenn Beck of Fox News, and the "Rally to Restore Sanity and/or Fear" by Jon Stewart and Stephen Colbert of Comedy Central. For any such rally, the estimated crowd size is a widely quoted--and disputed--measure of success. In the wake of controversy surrounding Louis Farrakhan's "Million Man March" in 1995, the National Park Service stopped making official estimates. | |||
Beck claimed that his rally attracted 300,000 to 500,000 attendees. CBS News announced an [http://www.cbsnews.com/8301-503544_162-20014993-503544.html estimate of 87,000], based on an analysis of aerial photos they had commissioned from AirPhotosLive.com. The same firm provided an [http://www.cbsnews.com/8301-503544_162-20021284-503544.html estimate of 215,000] for the Stewart-Colbert rally. Needless to say, these figures were widely debated in the blogosphere, along predictably partisan lines. | |||
Absent the politics, the mathematics for converting an aerial photo to a crowd estimate is straightforward: one simply divides area of interest by an estimate of crowd density (people per unit area). In practice, the total area may need to be subdivided into smaller, relatively homogeneous, subregions. The Ombudsman article here describes how the Post applied this logic to arrive at its estimate of 1 million for the inauguration of President Obama. | |||
<blockquote> | |||
It not only provided the satellite image online, but The Post also gave readers a step-by-step explanation of how the photo was analyzed in order to make an estimate. It noted those who were not included (people along the parade route or in side streets, for instance). Then it explained what experts calculate to be the area occupied by a single person in a crowd that is jam-packed (2.5 square feet), reasonably packed (up to 4.5 square feet) or loosely packed (10 square feet). The giant crowd was divided into zones, and each was assigned a density. Next, The Post noted what percentage of each zone was occupied by people. Finally, all the zones were totaled to produce the estimate. | |||
</blockquote> | |||
The satellite picture with accompanying analysis is available [http://www.washingtonpost.com/wp-dyn/content/graphic/2009/01/21/GR2009012100275.html here]. | |||
For further commentary on the inaugural (including musings on how to estimate the number of portable toilets required!), see the ''Wall Street Journal'' Numbers Guy story, [http://blogs.wsj.com/numbersguy/fuzzy-inaugural-math-490/ Fuzzy inaugural math] (8 January 2009). | |||
Submitted by Bill Peterson | |||
Latest revision as of 17:47, 21 February 2012
November 1, 2010 to November 28, 2010
Quotations
"If you're a politician, admitting you're wrong is a weakness, but if you're an engineer, you essentially want to be wrong half the time. If you do experiments and you're always right, then you aren't getting enough information out of those experiments. You want your experiment to be like the flip of a coin: You have no idea if it is going to come up heads or tails. You want to not know what the results are going to be."
Peter Norvig, as quoted at Slate Magazine.Submitted by Steve Simon.
Two quotes from Sir Francis Galton[1]:
“ I know of scarcely anything so apt to impress the imagination as the wonderful form of cosmic order expressed by the 'Law of Frequency of Error.' The law would have been personified by the Greeks and deified, if they had known of it. It reigns with serenity and in complete self-effacement, amidst the wildest confusion. The huger the mob, and the greater the apparent anarchy, the more perfect is its sway. It is the supreme law of Unreason. Whenever a large sample of chaotic elements are taken in hand and marshaled in the order of their magnitude, an unsuspected and most beautiful form of regularity proves to have been latent all along.”
“[Statistics are] the only tools by which an opening may be cut through the formidable thicket of difficulties that bars the path of those who pursue the Science of Man.”
Submitted by Margaret Cibes
Forsooth
A blogger responded to a John Allen Paulos article in The New York Times of October 24, 2010[2]:
”One can't really say anything meaningful about probability without actual data.”
Submitted by Margaret Cibes
In Time Magazine's print article "Marriage: What's It Good For?" (November 29, 2010) a sociologist is reported to have said
"About 21% of American Children will see at least two live-in partners of their mothers by the time they're 15. And an additional 8% will see three or more."
The article is available online as "Who Needs Marriage? A Changing Institution"[3]
Submitted by Chris Andrews
Paulos on probability
“Stories vs. Statistics”
by John Allen Paulos, The New York Times, October 24, 2010
In this article, Paulos discusses two classic probability problems, and 143 bloggers[4]respond en masse.
PROBLEM 1. With respect to the story of Linda the famous feminist bank teller, Paulos says that, while more details about a fictional character may make the story more believable, “the more details there are in a story, the less likely it is that the conjunction of all of them is true.”
In the classic illustration of the fallacy …, a woman named Linda is described. She is single, in her early 30s, outspoken, and exceedingly smart. A philosophy major in college, she has devoted herself to issues such as nuclear non-proliferation. So which of the following is more likely?
a.) Linda is a bank teller.
b.) Linda is a bank teller and is active in the feminist movement.
Paulos concludes, “Although most people choose b.), this option is less likely since two conditions must be met in order for it to be satisfied, whereas only one of them is required for option a.) to be satisfied.”
PROBLEM 1. Bloggers
No. 10. a.) is not necessarily more likely than b.). Paulos’ “understanding of others is weak,” and we need more information about how her activism may have led to sexual discrimination to answer the question.
No. 20’s response to #10. “Unless you believe that there could not possibly be such a person, Paulos is correct.”
PROBLEM 2, with variations. With respect to the classic two-boy problem, Paulos says that “our judgment of [a] probability is almost always affected by its intensional [sic] context.”
Given that a family has two children and that at least one of them is a boy, what is the probability that both children are boys? The most common solution notes that there are four equally likely possibilities — BB, BG, GB, GG …. Since we’re told that the family has at least one boy, the GG possibility is eliminated and only one of the remaining three equally likely possibilities is a family with two boys. Thus the probability of two boys in the family is 1/3. …. What if instead of being told that the family has at least one boy, we meet the parents who introduce us to their son? Then there are only two equally like possibilities — the other child is a girl or the other child is a boy, and so the probability of two boys is 1/2.
Paulos poses a “new variant of the two-boy problem”:
A couple has two children and we’re told that at least one of them is a boy born on a Tuesday. What is the probability the couple has two boys? Believe it or not, the Tuesday is important, and the answer is 13/27. If we discover the Tuesday birth in slightly different intensional [sic] contexts, however, the answer could be 1/3 or 1/2.
PROBLEM 2, with variations. Bloggers
No. 5. “[B]irth order is not part of the question, only whether the unidentified child is male or female, in which case the odds are 1 in 2 ….”
No. 7. Settembrini gives the calculations for the 13/27 problem.
No. 25, Ivan of NYC. “There is another version to the BG problem: suppose that in a family of two children, one is a girl named Emily. What is the probability that the other child is her sister? Turns out to be 1/2. (I was asked this question on an interview)”
Discussion
1. How would you respond to Blogger 10's comment about needing more information?
2. With respect to blogger 20, suppose that you believe that there could not possibly be such a person as Linda. What would be the probability of a.)? The probability of b.)? Would Paulos be correct in this case?
3. How would you respond to Blogger 5's comment about birth order?
4. Without viewing Blogger 7’s calculations, calculate the answer to the 13/27 problem. Do you agree with Blogger 7's calculations?
5. Do you agree with Blogger 25 about the probability when you know one child's name?
Submitted by Margaret Cibes
Comments
A reasonable explanation for the probability confusion alluded to in
a.) Linda is a bank teller.
b.) Linda is a bank teller and is active in the feminist movement.
is that the language of logic and the language of English are not identical. For example, "Or" in logic means either X or Y or both, whereas "or" in English usually means the exclusive "Or" in logic, either X or Y but not both.
When it comes to "and," the reader, when not misreading the "and" for "or," tends to substitute "who," so instead of X and Y, the reader is really considering X|Y which, depending on the reader's view of feminists and bank tellers, may or may not lead to the belief that (b) is more likely than (a).
Submitted by Paul Alper
Facebook data on relationship breakups
Using Facebook Updates to Chronicle Breakups, Nick Bilton, The New York Times Bits Blog, November 3, 2010.
David McCandless has a hobby that many would find odd, but perhaps not too odd to readers of Chance News.
David McCandless, a London-based author, writer and designer, is constantly playing with data sets available online and translating heaps of code into well-designed visual stories. Some of Mr. McCandless’s notable projects include visualizing the billions of dollars spent by people and governments around the world and visually explaining the different views of United States politicians, divided by their political predilection.
Facebook, a social network site, has data on relationship status: single, in a relationship, married, it's complicated, etc. With the help of Lee Byron of Facebook, he produced the following graph on breakups by looking at changes in relationship status.
The repeated peaks are Mondays, a day at higher risk of breakups. The general findings are that
most breakups occur three times in the year — in the weeks leading up to spring breaks, right before the start of the summer holidays and a couple of weeks before Christmas.
Questions
1. Changing one's status in Facebook is a surrogate measure of the actual ending of a relationship. What limitations does this produce in this data set?
2. Mr. McCandless claims that "people tend to break up with their significant others on Mondays, presumably after a weekend grapple." Is there an alternate explanation for the spike of breakups on Monday?
Submitted by Steve Simon
National polling 2010
“How Did The Polls Do?”
by Mark Blumenthal, HUFFPOST POLLSTER, November 3, 2010
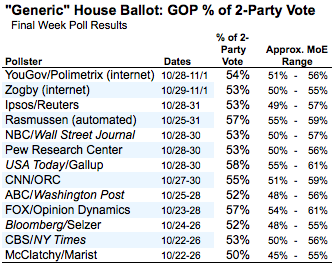
Blumenthal discusses the 2010 pre-election polls:
On average, the final statewide pre-election polls once again provided a largely unbiased measurement of the outcomes of most races, Congressional District polling had a slight Democratic skew, national polls that sampled both landline and cell phones measured national Congressional vote preference more accurately than those that sampled only landline phones and the venerable Gallup Poll took one on the chin. ...
[I]f we factor out the undecided and calculate the Republican percentage of the two-party vote for each survey, most capture the likely final result (53%) within their respective margins of error .... The most prominent exception is the Gallup Poll. The Republican share of the two-party vote predicted by their survey (58%) will likely miss the actual result by five percentage points, falling just outside the expected range of variation (55% to 61%). Gallup's error on the margin will likely be its biggest since it started asking the generic vote question 60 years ago.
http://images.huffingtonpost.com/2010-11-03-Blumenthal-Generic2Party1103.png
Submitted by Margaret Cibes Gallup's error on the margin will likely be its biggest since it started asking the generic vote question 60 years ago.
Nevada polling 2010
“Not All Polls Were Wrong In Nevada”
By Mark Blumenthal, HUFFPOST POLLSTER, November 6, 2010
While public media polls in late October consistently gave a slight advantage to Republican Senate challenger Sharron Angle, the internal campaign polls gave Democrat Harry Reid the edge and campaign pollsters on both sides attribute the difference to a combination of greater care in modeling the demographics of the electorate, more persistence in reaching all sampled voters and the added value of registered voter lists. [contributor's emphasis]
Candidate pollsters also attributed their successes to maintaining a constant model of the distribution of voters (by age, gender, race, region) across the surveys, having available rich data sets of past voter behavior, insisting on multiple callbacks to reach pre-identified but unavailable voters instead of relying on random-digit dialing or settling for phone answerers, and using hand-dialed cell phone numbers despite the additional work required. (Random-digit dialing to cell phones is banned by federal regulation.)
Discussion
1. Explain and/or comment on the following statement by the author:
While none of the margins on any one poll was large enough to attain statistical significance, the consistency of the results demonstrates that Angle's advantages did not occur by chance alone.
2. Do you agree with this statement by the author?
Our final "trend estimate" gave Angle a nearly three-point lead (48.8% to 46.0%) -- enough to classify the race as "lean Republican."
Submitted by Margaret Cibes
Galton board video
This is a nice YouTube video showing how the action of beads falling through an assortment of pins resembles the behavior of 5,000-6,000 monthly returns of the IFA Index Portfolio 100 over 50 years (through 2008).
There are three parts to the machine: (a) a fixed, drawn bell curve superimposed on glass over (b) a physical bar chart of thousands of beads representing the last 50 years of monthly average returns, and (c) a physical device randomly dropping beads through pins above the bar chart. A voiceover narrates the action of the falling beads, which is described as random.
Discussion
Comment on the following (spelling-edited) blogs[5].
1. “How is it random if all the beads are funneled into the center already. If a bead doesn’t start towards the right side, it’s never going to reach the right side.”
2. “Random would be an even distribution across the board. Random implies NO PATTERN …but this is clearly a pattern.”
Submitted by Margaret Cibes
Remarkable birthday pattern, or not?
“Mom’s babies born on 8-8-08, 9-9-09, 10-10-10”
by Elizabeth Weise, USA TODAY, October 14, 2010
The article quotes a University of Oregon biostatistician:
While the dates might seem “incredibly rare,” they're really not. Such a lineup can only happen in the first 12 years of the century and at least 10 months apart. …. Given that the first birth occurred in that window, the probability is not as astronomical as you might be compelled to think.
And a Berkeley statistician states:
[I]t's not that high a number at all. …. The 'chance' you get depends on the assumptions you make. …. One set of assumptions gives a chance of about 1 in 50 million. More realistic assumptions — including allowing at least 11 months between births — increases it to about 1 in 2,500. Since thousands of women in the United States had kids in 2008, 2009 and 2010, this suddenly seems a little less extraordinary.
Questions
1. Estimate the probability of these three birthdays, based on the Oregon professor’s statement. What other assumption(s), if any, did you need?
2. Can you confirm the Berkeley statistician’s figure of 1 in 2,500, based on his "more realitic" assumption?
3. How might the Berkeley statistician have arrived at the 1 in 50 million figure? What assumption(s) did you need?
Submitted by Margaret Cibes
Walking and dementia
As per usual, eye-popping headlines in the press and on the web can be misleading:
- MSNBC: “One way to ward off Alzheimer's: Take a hike”
- ABC News: “Walking May Keep Brain From Shrinking in Old Age”
- Punjab Newsline: “Walking helps retain memory in old age”
- Oregon Live: “Prime of life: Forget thinner thighs, new study shows walking protects brain size, saves memory”
- Independent: “Walking can save your memory”
- Thirdage: “Alzheimer’s Disease Can be Offset by Walking”
The research article on which this news coverage is based--Erickson, et al, “Physical activity predicts gray matter volume in late adulthood: The Cardiovascular Health Study”, Neurology, first published on October 13, 2010--has more modest proclamations.
We cannot conclude a causal association between PA [physical activity] and GM [gray matter] volume.
…given the observational nature of the study, we are unable to conclude that PA causes greater GM volume.
Greater amounts of walking are associated with greater gray matter volume, which is in turn associated with a reduced risk of cognitive impairment.
The study began in 1989-1990 with 1479 elderly subjects who “were free of dementia and mild cognitive impairment (MCI).” These subjects had their physical activity assessed at that time. In the nine years of follow-up, MRI’s were performed; this resulted in “299 cognitively normal subjects.” After four further years of follow-up, “183 remained cognitively normal in 2002-03” and “116 diagnosed MCI or dementia in 2002-03.” The authors chose to disaggregate the 299 into four groups depending on the number of blocks walked per week, 0-12, 13-24, 25-70 and 72-300 with 72 blocks being equated roughly to between 6 and 9 miles. The study claims that the last group had less gray matter shrinkage than any of the other three with no significant difference among the others.
Discussion
1. The data for the number of blocks walked per week were obtained by asking the participants. Why is this a problem?
2. Why was tennis rejected as a measure of physical activity?
3. The underlying belief is that walking has an effect on brain health. Defend the notion that brain health has an effect on the desire to walk. The authors put it this way: “there remains a possibility that reduced amounts of walking is a result of ill health and that ill health leads to both reduced amounts of walking and GM volume loss.”
4. The original data were obtained in 1989-1990 and the final data occurred in 2002-03; the paper has ten authors and was published in 2010. What does this say about the difficulties of studying humans as opposed to fruit flies?
5. According to Science 2.0: “The researchers found that those who walked the most cut their risk of developing memory problems in half.” Why is this “risk” a relative risk and not an absolute risk?
6. The study does not show the percentage of cognitive impairment in each of the four walking categories. Why would this be helpful?
7. The statement found in the Conclusion,
"Greater amounts of walking are associated with greater gray matter volume, which is in turn associated with a reduced risk of cognitive impairment"
hints, via the concept of transitivity, that greater amounts of walking is associated with a reduced risk of cognitive impairment. That is, if A is related to B and B is related to C, then A is related to C. However, see Langford, et. al. for a discussion of why this is not true in general. In particular, here is one of their counterexamples:
| X | Y | Z |
|---|---|---|
| 4 | 201 | 15 |
| 6 | 165 | 30 |
| 1 | 145 | 28 |
| 1 | 150 | 41 |
| 0 | 160 | 18 |
| 2 | 113 | 5 |
| 5 | 140 | 7 |
| 4 | 147 | 16 |
| 0 | 83 | 15 |
| 0 | 108 | 16 |
Use a stats package to show that even though the correlation between X and Y is positive, and the correlation between Y and Z is positive, but the correlation between X and Z is negative.
Submitted by Paul Alper
Crowd estimates
Crowd counts: When The Post did it right
by Andy Alexander, Washington Post, Ombudsman Blog, November 10, 2010
Recent months have seen two rallies on the National Mall by media personalities: the "Restoring Honor" rally by Glenn Beck of Fox News, and the "Rally to Restore Sanity and/or Fear" by Jon Stewart and Stephen Colbert of Comedy Central. For any such rally, the estimated crowd size is a widely quoted--and disputed--measure of success. In the wake of controversy surrounding Louis Farrakhan's "Million Man March" in 1995, the National Park Service stopped making official estimates.
Beck claimed that his rally attracted 300,000 to 500,000 attendees. CBS News announced an estimate of 87,000, based on an analysis of aerial photos they had commissioned from AirPhotosLive.com. The same firm provided an estimate of 215,000 for the Stewart-Colbert rally. Needless to say, these figures were widely debated in the blogosphere, along predictably partisan lines.
Absent the politics, the mathematics for converting an aerial photo to a crowd estimate is straightforward: one simply divides area of interest by an estimate of crowd density (people per unit area). In practice, the total area may need to be subdivided into smaller, relatively homogeneous, subregions. The Ombudsman article here describes how the Post applied this logic to arrive at its estimate of 1 million for the inauguration of President Obama.
It not only provided the satellite image online, but The Post also gave readers a step-by-step explanation of how the photo was analyzed in order to make an estimate. It noted those who were not included (people along the parade route or in side streets, for instance). Then it explained what experts calculate to be the area occupied by a single person in a crowd that is jam-packed (2.5 square feet), reasonably packed (up to 4.5 square feet) or loosely packed (10 square feet). The giant crowd was divided into zones, and each was assigned a density. Next, The Post noted what percentage of each zone was occupied by people. Finally, all the zones were totaled to produce the estimate.
The satellite picture with accompanying analysis is available here.
For further commentary on the inaugural (including musings on how to estimate the number of portable toilets required!), see the Wall Street Journal Numbers Guy story, Fuzzy inaugural math (8 January 2009).
Submitted by Bill Peterson