Chance News 37
Quotations
Expressing statistical concepts in accurate English is like walking a tightrope.
Patterico's Pontifications
If we can increase IQ by three to four points in the whole population, we can have fewer children at the low end and more Einsteins at the high end.
Human milk also contains cholesterol, while formula doesn't. We learned to fear cholesterol and yet cholesterol is very important for brain tissue, it's very important for nerve tissue. That's why human milk is a better nutrient to support brain growth
The following by Gary Taubes, a critic of low-fat diets, appeared as part of his lengthy New York Times Article in 2002.
The classic example is the statement heard repeatedly that 95 percent of all dieters never lose weight, and 95 percent of those who do will not keep it off. This will be correctly attributed to the University of Pennsylvania psychiatrist Albert Stunkard, but it will go unmentioned that this statement is based on 100 patients who passed through Stunkard's obesity clinic during the Eisenhower administration.
His 2007 book, "Good Calories, Bad Calories," is an expansion of the article. In short, Taubes alleges that there is little actual scientific evidence in favor of low-fat diets. He often refers to this belief in low-fat diets as a religion rather than a science.
Submitted by Paul Alper
Forsooth
Fall 1998 |
Fall 2006 |
% Change |
|
Student:faculty ratio |
10:1 |
8:1 |
-25% |
The next Forsooths are from RRS News, June 2008
Up to 69 you have a one in six chance of getting cancer. After 70 it drops to one in three.
BBC News website, 5 February 2008
Individuals who are 50-59 years-old and from the poorest fifth of the population are over ten times more likely to die than their peers from the richest fifth.
Institute for Fiscal Studies press release
7 July 2006
Breastfeeding
Except possibly for the manufacturers of formula milk, most people believe that breast milk is superior to infant formula with regard to the physical health of the child. According to "Breastfeeding and Child Cognitive Development," by Michael Kramer, et al, Archives of General Psychiatry, Vol. 65, (No. 5), May 2008, 578-584, breastfeeding is also superior for the mental development of the child.
The numbers are impressive: 17 authors, 17,046 infants enrolled, of whom 13,889 were followed up at age 6.5 years, at which time, according to HealthDay Reporter of May 5, 2008,
Those children who were exclusively breast-fed scored, on average, 7.5 points higher in verbal intelligence, 2.9 points higher in nonverbal intelligence, and 5.9 points higher in overall intelligence.
Nevertheless, with a closer look at the journal article, some of the numbers fade. Two of the three measures of intelligence just mentioned turn out not to be statistically significant. All in the control group also breastfed their infants with the difference being only the number of months of breastfeeding in the control group was less than in the (encouraged to breastfeed) treatment group. "[B]linding of the pediatricians [who administered the IQ test] to the experimental vs control group assignment was infeasible."
Discussion
1. Not so long ago, breast milk was not considered superior to infant formula. Make a case for the superiority of infant formula.
2. This study was carried out entirely in Belarus where according to the article, "> 95% of mothers in Belarus" choose to initiate breastfeeding. If the percentage in the U.S. is vastly different, how does this affect the generality of the conclusions?
3. The treatment group was "encouraged" to continue breastfeeding; the control group was neither encouraged nor discouraged. At the end of 12 months, those still breastfeeding were 19.7% and 11.4%, respectively. Ask a friendly librarian to find the comparison within the U.S. after 12 months.
4. IQ and intelligence are often conflated and elided. Use a search engine or that friendly librarian to find out how many different kinds of IQ tests there are. In addition, determine the strengths and weaknesses of the WASI test, the one used in the breastfeeding study.
5. The children in the study had their IQ measured via WASI at the age of 6.5 years. Did you ever have an IQ test? How old were you? Where you or your parents informed of your score? Were you ever retested? If so, did you go up or down? Do you feel that as far as intelligence is concerned, an individual is completely determined by the age of 6.5?
6. Although intelligence testing was originally proposed as a means of helping those who need help, IQ testing is often used as a form of rank ordering because of its precision and presumed accuracy. Richard Feynman, generally conceded to be the most prominent physicist of the second half of the 20th century, had an IQ, one point lower than his sister. Do a literature search to determine his IQ. Likewise, do a literature search to determine what his sister did with that one point advantage.
7. The lead author of the study backs off from the simplistic claim that "Long and exclusive breast-feeding makes kid smarter." Obtain the articles mentioned to see what else he says might be the causal reason for IQ improvement.
Submitted by Paul Alper
Longer limbs mean less risk of dementia
Longer limbs 'mean less risk of dementia'
Ian Sample, science correspondent
Guardian, Tuesday May 6 2008
Sample writes:
Leggy women and gangly men are less likely to develop Alzheimer's, according to a study that suggests a healthy upbringing protects against the degenerative disease. Researchers took limb measurements of 2,798 men and women with an average age of 72 and monitored them for five years. At the end of the study 480 had developed Alzheimer's or other types of dementia.
The study showed that women with longer legs had a much lower risk of dementia, with every extra inch of leg reducing their risk by 16%. Women with the shortest arms were 50% more likely to develop the disease than those with the longest arms. The study, which appears in the journal Neurology, revealed that only arm length was linked to men's risk of Alzheimer's, with every extra inch lowering their risk by 6%. Scientists who ran the study at Johns Hopkins University in Baltimore believe the link may be explained by poor nutrition in early life.
A second report in the same journal studied the effect of the painkiller ibuprofen on Alzheimer's disease. Doctors at Boston University Medical School found that people who used ibuprofen for at least five years had a 40% lower risk of dementia. The risk was lower among those who took the drug over longer periods. Because the effect is tentative, the scientists said ibuprofen should not be administered specifically to prevent dementia.
See the wiki below, "Mystical Significance," for a different take on the conclusions.
Cold hit DNA matches
DNA matches aren't always a lock
Genetic evidence is widely viewed as ironclad. In 'cold hit' cases, however, the truth is often elusive.
Los Angeles Times, May 3, 2008
Jason Felch and Maura Dolan
On Dec. 22, 1972 Diana Sylvester, 22 year old nurse was raped and murdered. In February 2008 this "cold case" was revived in 2006 by DNA evidence linking a John Puckett to the crime. ("cold case" is a criminal case which has not been solved after number of years. The article states:
For more than three decades, Sylvester's slaying went unsolved. Then, in 2004, a search of California's DNA database of criminal offenders yielded an apparent breakthrough: Badly deteriorated DNA from the assailant's sperm was linked to John Puckett, an obese, wheelchair-bound 70-year-old with a history of rape.
The DNA "match" was based on fewer than half of the genetic markers typically used to connect someone to a crime, and there was no other physical evidence.
At Puckett's trial earlier this year, the prosecutor told the jury that the chance of such a coincidence was 1 in 1.1 million.
Jurors were not told, however, the statistic that leading scientists consider the most significant: the probability that the database search had hit upon an innocent person.
In Puckett's case, it was 1 in 3. The question has been the subject of scientific controversy for more than 15 years and centers on how to calculate the probability that such a match would be the result of coincidence.
As the name suggests a DNA database is a collection of a large number of people's dna. When a crime has been committed and the police have a DNA sample at the scene of the crime but no other evidence for who it is they look in a DNA database to see if there is a person in the database whose dna matches that found at the scene of the crime. To determine a match, a small number of segments in a dna called markers that are rarely the same for two randomly chosen people are identified. These markers form a profile. The FBI database uses 13 such markers for their profiles.
So where did the 1 in 1.1 and 1 in 3 come from. The 1 in 1.1 million is an estimate of the probability that a dna randomly chosen from the population would have the same markers as the dna found at the seen of the crime. The article states that the 1/3 is the probability that the database search had hit upon an innocent person. In Puckett's case, it was 1 in 3
The difference between these two estimates is often explained in terms of the famous birthday problem. If you want to want to have about a 50% chance of finding someone with your birthday you would have to look at about 183 birthdays but if you just have a 50% chance for finding two people with the same birthday you have to only look at about 32 birthdays.
For much more information about this topic read Scientific Heat about Cold Hits by Keith Devlin.
Devlin mentions two attempts by the National Research Council to provide recommendations for how dna should be used in cold hit cases. In 1992 they made the following recommendation:
The distinction between finding a match between an evidence sample and a
suspect sample and finding a match between an evidence sample and one of many entries in a DNA profile databank is important. The chance of finding a match in the second case is considerably higher. … The initial match should be used as probable cause to obtain a blood sample from the suspect, but only the statistical frequency associated with the additional loci should be presented at
trial (to prevent the selection bias that is inherent in searching a databank
This was not well received so in 1996 the made the following recommendation:
Recommendation 5.1. When the suspect is found by a search of DNA
databases, the random-match probability should be multiplied by N, the number
of persons in the database
Presumeably this is the basis of the 1 in 3 probability above though even though this product is not a probability.
Devlin observes that this did not end of the story and describes in detail other methods for the use of DNA in cold hit cases that have been proposed including one based on a Bayesian analysis.
Åt the end of the Los Angeles Times article we read:
At 2:30 p.m. on March 6, after 48 hours of deliberation, the jurors filed into the courtroom with a verdict: guilty of murder in the first degree.
Puckett, now 74, sat motionless in his wheelchair. He later was sentenced to life in prison, with the possibility of parole after seven years. His attorneys said they would appeal.
Interviewed outside court after the verdict, jurors said they had struggled to weigh the different statistics. One said that the "likelihood ratio" was appealing because its name made sense in plain English.
In the end, however, jurors said they found the 1-in-1.1-million general-population statistic Merin had emphasized to have been the most "credible" and "conservative." It was what allowed them to reach a unanimous verdict.
"I don't think we'd be here if it wasn't for the DNA," said Joe Deluca, a 35-year-old martial arts instructor.
Asked whether the jury might have reached a different verdict if it had been given the 1-in-3 number, Deluca didn't hesitate.
"Of course it would have changed things," he said. "It would have changed a lot of things."
Submitted by Laurie Snell
Word frequency
WordCount is an interactive website that offers a neat visualisation of the 86,800 most frequently used English words, ranked in order of frequency.
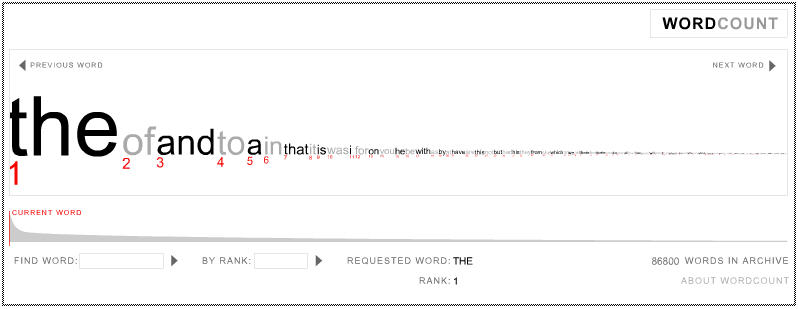 Snapshot of the layout of WordCount. Source: WordCount.
The attached figure shows the layout of WordCount. For example, relative frequency is proportional to font size, to emphasise each word's level of usage.
The website author, Jonathan Harris, explains:
WordCount was designed with a minimalist aesthetic, to let the information speak for itself. ... The goal is for the user to feel embedded in the language, sifting through words like an archaeologist through sand, awaiting the unexpected find. Observing closely ranked words tells us a great deal about our culture. For instance, 'God' is one word from 'began', two words from 'start' and six words from 'war'. Another sequence is "america ensure oil opportunity". ... As ever, the more one explores, the more is revealed.
Some sample word rankings (taken from the top of Chance News 36) are: statistics (3,010), teaching (1,134), number (171), numbers (894), jackpot (25,498).
Questions
- WordCount includes all words that occur at least twice in the British National Corpus (BNC), a 100 million word collection; yet, WordCount only contains 86,800 words.
- What can you infer from this about the distribution of word frequencies?
- WordCount is a full enumeration of the BCN and the BCN is such a large sample, so does that mean that the estimates of word rankings are accurate? For example, six words chosen from Chance News 36 included the word 'forsooth', which seems to be in the BNC five times but is not in WordCount. (The other five words and their rankings are listed above.)
- What other information would you like to have to investigate variations in word frequencies and where could you start looking?
- The layout presents the data (word counts) as a density distribution, with a lookup for individual work rankings. It doesn’t display word frequency or percentiles, would they be more helpful or informative than rankings?
- What is your estimate of the rank of words like 'chance' and 'probability' or 'statistician' and 'mathematician' in the BNC?
- Have you any confidence in your prediction? You might want to consult the recent Plus Magazine article Understanding uncertainty: The Premier League, by Mike Pearson and David Spiegelhalter, before producing a confidence interval for rankings.
- The author plans to apply the technique to any text, such as a website or the whole internet. What standard statistical techniques can you think of to highlight differences in word count distributions across different sources? Do any emphasise a visual, interactive approach to data analysis, as is done with WordCount? If not, why not?
- Do you agree with the statement observing closely ranked words tells us a great deal about our culture?
- Find 'chance' in the rankings. How likely is it that there is a 'logical' link between 'chance' and its nearest neighbours? If you now expand the neighbourhood around 'chance', how quickly do you think your chances of finding a 'logical' link become? Would it matter if 'chance' could be substituted by equivalent conceptual words, like 'odds' or 'probability'?
- For example, The Washington Post's Sunday humor/wordplay contest, ran a challenge to write a four-line poem incorporating any four or more successive WordCount words in order (but not necessarily adjacently). Can you use those results as an example of a logical link and how likely it is to occur?
- See A coincidenc?, from Chance News 32 for a related article.
- While WordCount tracks the way we use language; QueryCount is a related website that tracks the way WordCount is used, by rearranging its word rankings based on the number of times each word has been queried by WordCount. So QueryCount contains statistics of search usage with WordCount.
- What differences do you expect to find between these two distributions, if any? For example, how much more likely is it that your first name has a higher ranking in QueryCount than in WordCount, on the premise that people are more likely to look up their own name (contributing to its QueryCount ranking) than that word is likely to occur in the BNC (contributing to its WordCount ranking), which changes more slowly over time. Can you infer anything about how representative the BNC is of English language usage on the internet?
- How likely are you to find a word in WordCount that is not in QueryCount?
Further reading
- Here are two web pages (Conspiracy Game and 1970s Movie Characters) devoted to finding neighbouring words that are 'connected' (it is claimed).
- Aside: The BCN is a potentially useful source of quotes about your favourite topic.
Submitted by John Gavin.
Mystical Significance
We clearly need a term for numerical data which seem to say something but the closer one looks, the less is there to see: “mystical significance” might fill the bill. For example, a previous wiki, “Longer limbs means less risk of dementia” has an impressive number of subjects, 2798, and impressively precise regression coefficients purporting to demonstrate that the longer the limbs the less chance of developing dementia.
The journal article referred to, “Knee height and arm span: A reflection of early life environment and risk of dementia,” by Huang, et al, Neurology, 70, 19, 2008, 1818-1826, uses the observational data from the Cardiovascular Health Cognition Study. But so do a bunch of earlier publications mining the same 2,798 subjects or whom “480 had developed Alzheimer's or other types of dementia.” Knee height was measured three years before the study began (1989-1990) and arm span was measured four years after the baseline (1996-1997). Dementia was assessed in 1998-1999. Thus, the publication in 2008 is almost twenty years from the original accumulation of numbers.
Knee height and arm span were measured along with race, gender, age education, income and a particular genotype, indicating perhaps that multiple testing or multiple comparisons were tried. If, as the authors suggest, early life influences body growth and “susceptibility to chronic disease in later life,” why is Alzheimer’s associated with these anthropometric measurements but not vascular dementia? But why knee height in the first place? Why arm span? Why not shoe size, hand span, height or distance between the shoulder blades?
The same 2,798 subjects with the 480 cases of dementia mystically appears three years earlier in “Statin use and the risk of incident dementia: the Cardiovascular Health Study,” by Rea, et al, Arch Neural, 2005; 62: 1047-1051. Here, instead of anthropometric measurements the focus is on statin drugs which according to this study did not seem to reduce risk.
The ibuprofen observational study, “Protective effects of NSAIDs on the development of Alzheimer’s disease,” by Vlad, et al, Neurology, 70 May, 2008, 1672-1677, has 49,349 U.S. veterans age 55 or over with Alzheimer’s and 196,850 veterans without dementia. Closer inspection reveals that over 97% were male so any conclusion regarding women is immediately suspect. With the exception of ibuprofen, the NSAIDS had no therapeutic effect.
Fortunately, ibuprofen is very inexpensive. Unfortunately, the common side effects of ibuprofen are rash, ringing in the ears, headaches, dizziness, drowsiness, abdominal pain, nausea, diarrhea, constipation and heartburn. From [1] is the cautionary note, "Individuals should not use ibuprofen for more than 10 days for the treatment of pain or more than 3 days for the treatment of a fever unless directed by a physician." Nevertheless, the study says the best result for reduction of Alzheimer's is to use ibuprofen for more than five years. However, only "Four hundred cases (0.81%) and 1,952 controls (0.99%) used NSAIDs for longer than 5 years." Presumably, only around a fifth of those involved ibuprofen, consequently the sample size is reduced to about 500.
According to [2], "The investigators were keen to point out that an observational study such as this one cannot prove that NSAID directly cause the reduction in risk. It could be something about the people that chose to use NSAIDS that drove down the risk. These findings do not justify taking NSAIDS as a way to prevent dementia, they warned."
A microscopic pvalue
The burden of disease associated with filaggrin mutations: a population-based, longitudinal birth cohort study. Henderson J, Northstone K, Lee SP, Liao H, Zhao Y, Pembrey M, Mukhopadhyay S, Smith GD, Palmer CN, McLean WH, Irvine AD. J Allergy Clin Immunol. 2008 Apr;121(4):872-7.e9.
While the full text of this article is not freely available on the web, there is a statistic summarized in the abstract which is rather fascinating.
Strong associations were identified with sensitization to grass, house dust mite, and cat dander and sensitization to multiple allergens (odds ratio, 2.12; 95% CI, 1.03-4.37; P = 5.42 x 10(-27)).
This is a rather impressive p-value, but the confidence interval appears to show a result that just barely achieves statistical significance.
Questions
1. Which measure, the p-value or the confidence interval, provides a fairer picture of the practical significance of this finding?
2. Some researchers will take any p-value smaller than 0.0001 and round it up to 0.0001. Others will report the p-value in scientific notation. Is there any value in noting the exact size of the p-value when it is smaller than 0.0001?
3. While it is impossible to convert a p-value into a confidence interval, it may be possible to convert a confidence interval into a p-value. Assume a simple formula for the confidence interval for an odds ratio and see if it is possible to produce such a small p-value from such a borderline confidence interval.
Submitted by Steve Simon
