Chance News 22
Quotations
It would be hard to make a probability course boring.
William Feller
Personal comment to Laurie Snell
Apart from Fred, [an obstreperous rat in her psychology lab] I was sick of trying to master statistics. I had a mental block when it came to any form of mathematics. 'Rats and stats,' I complained to a fellow student one day, 'I came here to learn about people.' I wasn't the only student disgruntled. Many complained but to no avail.
Sally Morgan in her book, My Place
The risk of going into cardiac arrest as a spectator, he [Dr. Siegal of Massachusetts General Hospital] said, is only about one in a million. (The applicable studies of spectators involved Super Bowl fans.)
Forsooth
NOAA's heating degree day forecast for December, January and February projects a 2 percent warmer winter than the 30 year average
The following Forsooths are from the November 2006 RRS NEWS.
At St John's Wood station alone, the number of CCTV cameras has jumped from 20 to 57, an increase of 300 per cent.
Metro
3 May 2006
Now 78% of female veterinary medicine students are women, almost a complete turn-around from the previous situation.
The Herald (Glasgow)
4 May 2006
Drought to ravage half the world within 100 years
Half the world's surface will be gripped by drought by the end of the century, the Met Office said yesterday.
Times online
6 October 2006
An election puzzle?
Can predictions markets be right too often?
David Pennock
Prediction map post mortem.
Robert Forsythe
We have discussed the use of betting markets to predict the autcomes of elections several times in Chance News. See for example Chance News 12.02
Lance Fornow Computer Scientist at the Universsity of Chicago, David Pennock and Chen Yiling Research Scientists at Yahoo have carried out research to evaluate the ability of markets such as Tradesports, the Iowa Political Markets and other such markets to predict the outcomes of elections, sports events, Oscar winners etc.
To look at Tradesports ability to predict the outcome of the 2006 Senate race, they produced the following map showing their predictions as of about 9 AM CST election day.
http://weblog.fortnow.com/media/election-day-2006-map.JPG Every state colored blue was won by a democrat and every state colored red went to a republican. But also note the 69% given to GOP (Republican) Senate control although this election will give control to the democrats. No outcome would have made all the states and senate control agree with the 9 AM map.
Were the markets inconsistent? No, because the markets predict not absolutely but probabilistically. For example, the markets gave a probability of winning 60% for each of Virginia and Missouri and the democrats needed both to take the senate. If these races were independent events, the probability that the democrats take both is 36% or a 64% chance of GOP senate control assuming no other surprises.
Of course the races were not independent events and there are other states involved making it more difficult to compare the probabilities of the individual races with that of senate control.
So how did the markets do as predictors? Quite well as the outcome seems quite reasonable given the markets. Other outcomes would have also been reasonable such as the Democrats losing Virginia and the senate remaining in republican hands, a possibility that came very close to happening.While it seems likely that the individual races are not indpendent of the control of the senate it is interesting to see if this is correct and if so how would we mesure the dependence.
To consider further we describe how the Tradesports betting works. We illustrate this using a current bet you can make relating to who the democrats will nomenate to be the canditate in the 2008 presidential election.
You can buy or sell contracts. At the time this was written you could buy or sell contracts at the prices given in the following table. The number of contracts you could buy or sell at a particular price is also given in the table.
http://www.dartmouth.edu/~chance/wikivideos/clintonbidask.jpg If you own a contract and Hillery wins you will be paid $100 and if she loses you will be paid $0.
The price of a contract varies through time as illustrated by the following graphic:http://www.dartmouth.edu/~chance/wikivideos/clintongraph.jpg to be continue
I wasn't making up data, I was imputing!
An Unwelcome Discovery, by Jeneen Interlandi, The New York Times, October 22, 2006.
The New York Times has an informative summary of a recent scandal involving a prominent researcher at the University of Vermont, Eric Poehlman. The Poehlman scandal represents perhaps the biggest cases of research fraud in recent history.
He presented fraudulent data in lectures and in published papers, and he used this data to obtain millions of dollars in federal grants from the National Institutes of Health — a crime subject to as many as five years in federal prison.
The first person to speak up about the possibility of fraud in Poehlman's work was one of his research assistants, Walter DeNino.
The fall that DeNino returned to the lab, Poehlman was looking into how fat levels in the blood change with age. DeNino’s task was to compare the levels of lipids, or fats, in two sets of blood samples taken several years apart from a large group of patients. As the patients aged, Poehlman expected, the data would show an increase in low-density lipoprotein (LDL), which deposits cholesterol in arteries, and a decrease in high-density lipoprotein (HDL), which carries it to the liver, where it can be broken down. Poehlman’s hypothesis was not controversial; the idea that lipid levels worsen with age was supported by decades of circumstantial evidence. Poehlman expected to contribute to this body of work by demonstrating the change unequivocally in a clinical study of actual patients over time. But when DeNino ran his first analysis, the data did not support the premise.
When Poehlman saw the unexpected results, he took the electronic file home with him. The following week, Poehlman returned the database to DeNino, explained that he had corrected some mistaken entries and asked DeNino to re-run the statistical analysis. Now the trend was clear: HDL appeared to decrease markedly over time, while LDL increased, exactly as they had hypothesized.
Although DeNino trusted his boss implicitly, the change was too great to be explained by a handful of improperly entered numbers, which was all Poehlman claimed to have fixed. DeNino pulled up the original figures and compared them with the ones Poehlman had just given him. In the initial spreadsheet, many patients showed an increase in HDL from the first visit to the second. In the revised sheet, all patients showed a decrease. Astonished, DeNino read through the data again. Sure enough, the only numbers that hadn’t been changed were the ones that supported his hypothesis.
Poehlman brushed DeNino's concerns aside, so DeNino started asking around and other graduate students and postdocs had similar concerns. He got some cautionary advice from a former postdoctoral fellow
Being associated with either falsified data or a frivolous allegation against a scientist as prominent as Poehlman could end DeNino’s career before it even began.
and a faculty member who shared lab space with Poehlman who advised
If you’re going to do something, make sure you really have the evidence.
So DeNino started looking for the evidence.
DeNino spent the next several evenings combing through hundreds of patients’ records in the lab and university hospital, trying to verify the data contained in Poehlman’s spreadsheets. Each night was worse than the one before. He discovered not only reversed data points, but also figures for measurements that had never been taken and even patients who appeared not to exist at all.
DeNino presented his evidence to the university counsel and the response of Poehlman (to his department chair, Burton Sobel) was rather startling.
The accused scientist gave him the impression that nothing was wrong and seemed mostly annoyed by all the fuss. In his written response to the allegations, Poehlman suggested that the data had gotten out of hand, accumulating numerous errors because of handling by multiple technicians and postdocs over the years. “I found that noncredible, really, for an investigator of Eric’s experience,” Sobel later told the investigative panel. “There had to be a backup copy that was pure,” Sobel reasoned before the panel. “You would not have postdocs and lab techs in charge of discrepant data sets.” But Poehlman told Sobel that there was no master copy.
At the formal hearing, Poehlman had a different defense.
First, he attributed his mistakes to his own self-proclaimed ineptitude with Excel files. Then, when pressed on how fictitious numbers found their way into the spreadsheet he’d given DeNino, Poehlman laid out his most elaborate explanation yet. He had imputed data — that is, he had derived predicted values for measurements using a complicated statistical model. His intention, he said, was to look at hypothetical outcomes that he would later compare to the actual results. He insisted that he never meant for DeNino to analyze the imputed values and had given him the spreadsheet by mistake.
The New York Times article points out how pathetic this attempted explanation was.
Although data can be imputed legitimately in some disciplines, it is generally frowned upon in clinical research, and this explanation came across as hollow and suspicious, especially since Poehlman appeared to have no idea how imputation was done.
A large portion of the article examines how research fraud can occur in a system that is supposed to be self-correcting.
First, the people who are mostly likely to notice fraud are junior investigators who are subordinate to their research mentor. It's psychologically and emotionally difficult to confront someone who has devoted time to your professional development. Even when an investigator is emotionally willing to confront their mentor, they have their career concerns to worry about.
The principal investigator in a lab has the power to jump-start careers. By writing papers with graduate students and postdocs and using connections to help obtain fellowships and appointments, senior scientists can help their lab workers secure coveted tenure-track jobs. They can also do damage by withholding this support.
Every university will have a system in place to investigate claims of fraud. But there are problems here as well.
All universities that receive public money to conduct research are required to have an integrity officer who ensures compliance with federal guidelines. But policing its scientists can be a heavy burden for a university. “It’s your own faculty, and there’s this idea of supporting and nurturing them,” says Ellen Hyman-Browne, a research-compliance officer at the Children’s Hospital of Philadelphia, a teaching hospital. Moreover, investigations cost time and money, and no institution wants to discover something that could cast a shadow on its reputation.
“There are conflicting influences on a university where they are the co-grantor and responsible to other investigators,” says Stephen Kelly, the Justice Department attorney who prosecuted Poehlman. “For the system to work, the university has to be very ethical.”
Poehlman himself was careful and chose areas where fraud would be especially difficult to detect. He specialized in presenting longitudinal data, data that is very expensive to replaicate. He also presented research results that confirmed what most researchers had suspected, rather than results that would undermine existing theories of nutrition.
At his sentencing, Poehlman was sentenced to one year and one day in federal prison, making him the first researcher to serve time in jail for research fraud.
“When scientists use their skill and their intelligence and their sophistication and their position of trust to do something which puts people at risk, that is extraordinarily serious,” the judge said. “In one way, this is a final lesson that you are offering.”
Questions
1. Do you have experience with a researcher changing the data values after seeing the initial analysis results? What would make you suspicious of fraud?
2. Is the peer-review system of research self-correcting? What changes could be made to this system?
3. When is imputation legitimate and when is it fraudulent?
Submitted by Steve Simon
Independence for national statistics
A better way to restore faith in official statistics, John Kay, Financial Times 25 July 2006.
John Kay, a columnist for the Financial Times, outlines the measures needed to ensure that national statistics are truly independent.
The current state of UK official statistics was covered in a previous Chance article Pick a number, any number, in Chance News 9. That article summarised a report on this topic, to which professional users, such the Royal Statistical Society, gave a cautious welcome to the government’s announcement of independence for the UK Office of National Statistics (ONS).
Kay's article follows up on the reaction to that report. He tells us that accurate public information is a prerequisite of democracy, governement statisticians are honest people but ministers (politicians) needs are often for propaganda rather than facts. Kay claims that decentralisation of responsibility for the production of official statistics has created a two-tier system in the UK.
statistics produced by the Office for National Statistics (ONS), which operates to internationally agreed criteria, are of higher quality than those produced by (government) departments.
The proposal to hand repsonsibility for all official statistics to the ONS was rejected, as were the suggestions for greater independence, made by bodies such as the Statistics Commission and the Royal Statistical Society,
- separating statistical information from political statements,
- reducing access by ministers to new data before their release,
- giving parliament a defined role in the appointment of the National Statistician.
Instead, the lastest news is that the ONS will be demoted to a non-ministerial department. The worst news is the abolition of the Statistics Commission, which reviews all government statistics, and has made itself unpopular with government by proving itself robustly independent.
Kay also cautions that statistics may be misused in contexts other than those intended. The value of health services increases as incomes rise and it can be argued that this increases the value of health output even if outcomes and procedures are unchanged. This statistical adjustment provides no basis whatever for claims that the National Health Service is more efficient. But the assertion grabs a headline, and it is only much later that pedantic journalists and academics can discover what is actually going on.
Submitted by John Gavin.
An example of Simpson's Paradox
Study finds wealth inequality is widening worldwide
New York Times, Dec. 6, 2006, C-3
Eduardo PorterThe article contains stats from a 2000 report on wealth distribution by country and worldwide. The article points out (toward the end) that even though every country has seen growing income inequality in the last six years, the *worldwide* inequality gap may be narrowing from the year 2000 stats to the present. The reason is the huge growth and wealth accumulation in China and India, which raises income overall, even though both those countries have also seen greater inequality.
Submitted by Dob Dobrow
Predecessors of Poehlman
Steve Simon's wiki, "I wasn't making up data, I was imputing!" is quite interesting and informative. Nevertheless, some elaboration is in order regarding fraud and Simon's statement that "The Poehlman scandal represents perhaps the biggest cases of research fraud in recent history."
The term "recent history" is sufficiently elastic to permit quoting myself in the 1980s:
Admittedly Slutsky is an extreme example...even after the investigation [proving fraud in many of his papers]...Robert G. Slutsky was [still] given credit for [an additional] 77 publications in his seven years with [the University of California, San Diego]...in 1984 he published at the astonishing rate of one paper every ten days..Slutsky's phenomenal productivity was encouraged, applauded and rewarded...John R. Darsee [another cardiologist but at Harvard], had about 100 papers in a period of two years and his undoing in 1981 was colleagues who secretly saw him forging the data.
Put Slutsky and Darsee into Google.com and you will see the entire treatment. My point is that the Eric Poehlman scandal is nowhere near the biggest--Slutsky and Darsee involved entire prestigious labs. And we tend to ignore history at our peril. An extensive treatment of Slutsky, Darsee and many others (Baltimore, Imanishi-Kari, Spector, Summerlin, Long, Alsabti, Soman, Breuning, Pearce, Hermann, Brach, Schoen, not to mention more illustrative predecessors such as Newton, Mendel, Pasteur and Freud) can be found in The Great Betrayal: Fraud in Science by Horace Freeland Judson [Harcourt, Inc., 2004].
Although Judson's book is a wonderful page-turner, go to www.bmj.com/cgi/content/full/329/7471/922 to see a critique of the book by Peter Wilmshurst, a British cardiologist who is very active in unearthing medical fraud. Wilmshurst suggests that "Judson paints a rosier picture of the mechanisms for dealing with research fraud than I recognize." Further, "Judson only briefly describes what may be the most common form of research misconduct: failure to publish results...for the sake of company profits."
Although research frauds tend to have things in common--colossal egos, external as well as internal pressures, desire for fame, money, etc.--each instance is possibly unique. Poehlman evidenced a typical trait: he fabricated the data. According to the original New York Times article, his study on menopause "was almost entirely fabricated. Poehlman had tested only 2 women, not 35." On the other hand, Poehlman was downright stupid to have changed his (real, existing) cholesterol data to fit his (and others) belief that cholesterol levels worsen with age because he had the only large longitudinal study, implying that it would be publishable and valuable regardless of the results. The other unusual feature was that "He was only the second scientist in the United States to face criminal prosecution for falsifying research data."
Buried in the NYT article is the statement made by Steven Heymsfield, an obesity researcher at Merck and should be a guiding light for all researchers: "But deans love people who bring in money and recognition to universities, so there is Eric."
Discussion
1. Use a search engine to determine what fraud was committed by some of the predecessors of Poehlman.
2. Scientists claim that peer review and duplication of results act to inhibit fraud. Pick a researcher and determine why either or both failed.
3. This wiki ends with a disparaging remark about university deans. Defend them.
Submitted by Paul Alper
Wealth of nations
- Winner takes (almost) all, The Economist, 9th Dec 2006.
- Pioneering study shows richest 2 percent own half world wealth, James Davies of the University of Western Ontario, Anthony Shorrocks and Susanna Sandstrom of UNU-WIDER and Edward Wolff of New York University.
The Helsinki-based World Institute for Development Economics Research of the United Nations University (UNU-WIDER) has conducted what it claims is a path-breaking study into the most comprehensive study of personal wealth ever undertaken: it is the first-of-its-kind to cover all countries in the world and all major components of household wealth, including financial assets and debts, land, buildings and other tangible property.
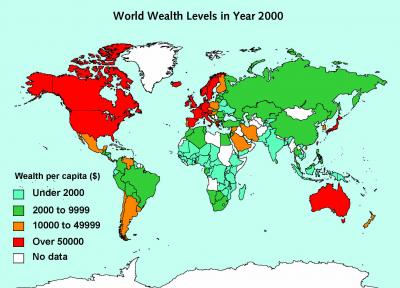 World Wealth Levels in Year 2000: The world map shows per capita wealth of different countries. Average wealth amounted to $144,000 per person in the USA in year 2000, and $181,000 in Japan. Lower down among countries with wealth data are India, with per capita assets of $1,100, and Indonesia with $1,400 per capita. Source: UNU-WIDER.
The report contains a plethora of statistics, such as:
- The richest 2% of adults in the world own more than half of global household wealth.
- The richest 1% of adults alone owned 40% of global assets in the year 2000.
- The richest 10% of adults accounted for 85% of the world total.
- The bottom half of the world adult population owned barely 1% of global wealth.
- To be among the richest 10% of adults in the world required $61,000 in assets.
- More than $500,000 was needed to belong to the richest 1% (37 million members).
- Household wealth amounted to $125 trillion in the year 2000, equivalent to roughly three times the value of total global production (GDP) or to $20,500 per person. Adjusting for differences in the cost-of-living across nations raises the value of wealth to $26,000 per capita when measured in terms of purchasing power parity dollars (PPP$).
- Wealth levels vary widely across countries: ranging from $37,000 per person for New Zealand and $70,000 for Denmark to $127,000 for the UK (for high-income OECD nations).
- North America has only 6% of the world adult population, yet it accounts for 34% of household wealth.
- Wealth is more unequally distributed than income across countries. High income countries tend to have a bigger share of world wealth than of world GDP. The reverse is true of middle- and low-income nations.
World Wealth Levels in Year 2000: The world map shows per capita wealth of different countries. Average wealth amounted to $144,000 per person in the USA in year 2000, and $181,000 in Japan. Lower down among countries with wealth data are India, with per capita assets of $1,100, and Indonesia with $1,400 per capita. Source: UNU-WIDER.
The authors warn about the ambiguity in the definition of wealth
One should be clear about what is meant by 'wealth'. In everyday conversation the term 'wealth' often signifies little more than 'money income'. On other occasions economists use 'wealth' to refer to the value of all household resources, including human capabilities.
The authors define wealth to mean 'the value of physical and financial assets less debts', so wealth represents the ownership of capital. They claim that capital is widely believed to have a disproportionate impact on household wellbeing and economic success, and more broadly on economic development and growth.
The authors use the Gini value to measure inequality on a scale from zero to one. They claim that wealth is shared much less equitably than income. Income inequality ranges from 35% to 45% and wealth inequality are usually between 65% and 75% (e.g. zero would mean everyone has the same income and one means that one person has all the income and everyone else has none). The authors claim
The global wealth Gini for adults is 89%. The same degree of inequality would be obtained if one person in a group of ten takes 99% of the total pie and the other nine share the remaining 1%.
Surprisingly, household debt is seen as relatively unimportant in poor countries. As the authors of the study point out:
while many poor people in poor countries are in debt, their debts are relatively small in total. This is mainly due to the absence of financial institutions that allow households to incur large mortgage and consumer debts, as is increasingly the situation in rich countries. Many people in high-income countries have negative net worth and—somewhat paradoxically—are among the poorest people in the world in terms of household wealth.
For example, the bottom half of the Swedish population have a collective net worth of less than zero, although Nordic countries, in general, seem to thrive with relatively little personal wealth.
Questions
- A presentation format consisteing of a list of such point-estimate statistics seems disjointed, as it swaps repeatedly between statistics for the richest and the poorest. Could the data be more meaningfully presented via a distribution?
- The graph shows a discrete five point distribution. Is such a split of the data into buckets such as 'under 2000' and 'over 50000' meaningful?
- Mapping the output to countries via colours, shows the geographic distribution of the underlying variable, wealth. What is misleading about this graph? High might countries be scaled in size to better relflect the data.
- How might switching from measuring wealth to income affect the preception of the results? (A gini measure of income inequality is available from Wikipedia, along with time trends since the 1940s.)
- Two high wealth economies, Japan and the United States, show very different patterns of wealth inequality, with Japan having a wealth Gini of 55% and the USA a wealth Gini of around 80%. Speculate on what factors might explain this difference.
Submitted by John Gavin.
Science in the Courtroom
When questions of science come to a courtroom, truth has many faces
New York Times, 5 December 2006, F3
Cornelia DeanThis article appeared as the US Supreme Court began hearing its first case involving global warming. A case has been filed against the federal government by a group of state and local goverments, together with environmental groups. These plaintiffs charge that that the Environmental Protection Agency, by refusing to regulate greenhouse gas emissions, is failing to enforce the Clean Air Act.
Some of the arguments involve legal technicalities, such as whether the states actually have standing to bring such a suit. But the present article is concerned with the scientific evidence, and what responsibility the Court has to educate itself about the scientific underpinnings of a case. The article draws the following distinction between between statistical and legal standards for proof:
Typically, scientists don't accept a finding unless, statistically, the odds are less than 1 in 20 that it occurred by chance. This standard is higher than the typical standard of proof in civil trials ("preponderance of the evidence") and lower than the standard for criminal trials ("beyond a reasonable doubt").
The article provides some historical references on how the Court has previously viewed scientific testimony, beginning discussion of the 1923 Frey case on lie detectors, which introduced the "general acceptance" standard. This was updated in the 1993 case Daubert v. Merrell Dow Pharmaceuticals, which involved the drug Bendectin and it possible association with birth defects. The Court introduced the concepts of "testability" and "peer review" into its deliberations on science. In the 1998 case General Electric Company v. Joiner, the Court ruled that "judges could reject evidence if there was simply too great a gap between 'the data and the opinion proffered.'"
The main thrust of the article, however, is that the Court still has been too slow to keep up with the explosion of scientific knowledge, which can be expected to play an ever larger role in future cases. For example, when corrected on a technical point in the discussion about carbon dioxide, Justice Scalia responded, "Troposphere, whatever. I told you before I'm not a scientist."
DISCUSSION QUESTIONS
(1) What do you think of the suggested correspondence between the legal and statistical standards for evidence? What probability numbers would you attach to "preponderance of the evidence" and "beyond a reasonable doubt"?
(2) How should a judge decide when there is too great a gap between "the data and the opinion proffered"? Submitted by Bill Peterson
