Chance News 110: Difference between revisions
| Line 2: | Line 2: | ||
==Forsooth== | ==Forsooth== | ||
==Statistical artifacts== | ==Statistical artifacts== | ||
Revision as of 00:52, 16 June 2017
Quotations
Forsooth
Statistical artifacts
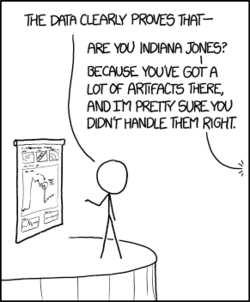
https://xkcd.com/1781/ Artifacts]
from XKCD [1]
Statins and Alzheimer's
Why statins probably don’t reduce risk of Alzheimer’s disease, despite what headlines say
by Alan Cassels, HealthNewsReview, 14 December 2016
Gender stereotypes
[Gender stereotypes about intellectual ability emerge early and influence children’s interests]
The distribution of women and men across academic disciplines seems to be affected by perceptions of intellectual brilliance. Bian et al. studied young children to assess when those differential perceptions emerge. At age 5, children seemed not to differentiate between boys and girls in expectations of “really, really smart”—childhood's version of adult brilliance. But by age 6, girls were prepared to lump more boys into the “really, really smart” category and to steer themselves away from games intended for the “really, really smart.”
Hans Rosling
Margaret Cibes sent a link to the following:
- Hans Rosling, Swedish doctor and pop-star statistician, dies at 68
- by Sam Roberts, New York Times, 9 February 2017
Gaussian correlation inequality
Pete Schumer sent a link to the following:
- A long-sought proof, found and almost lost
- by Natalie Wolchover, Quanta, 28 March 2017
Flint water crisis
The murky tale of Flint's deceptive water data
by Robert Langkjær-Bain, Significance, 5 April 2017
What went wrong In Flint
by Anna Maria Barry-Jester, FiveThirtyEight, 26 January 2016
Same stats (think Anscombe)
Jeff Witmer sent this link to the Isolated Statisticianssamestats Same stats, different graphs: Generating datasets with varied appearance and identical statistics through simulated annealing]
- by Justin Matejka, ACM SIGCHI Conference on Human Factors in Computing Systems
Observing that it is not known how Frank Anscombe went about creating his famous quartet of scatterplots, the authors present the results of their simulated annealing technique to produce some striking visualizations. Worth a look just to see their Datasaurus Dozen, which even has an R data package.
Interracial marriage
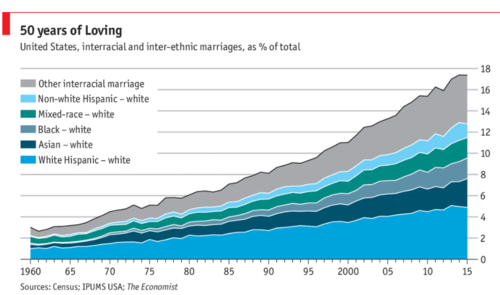
Peter Doyle sent a link to this chart from the Economist:
- Daily chart: Interracial marriages are rising in America
- Economist, 12 June 2017
 ,
,Quoting from the article, one reader commented:
"Of the roughly 400,000 interracial weddings in 2015, 82% involved a white spouse, even though whites account for just 65% of America’s adult population. " If you lump the population into just two groups A and B, 100% of intergroup marriages will involve a spouse from group A, no matter what fraction of the population belongs to group A.
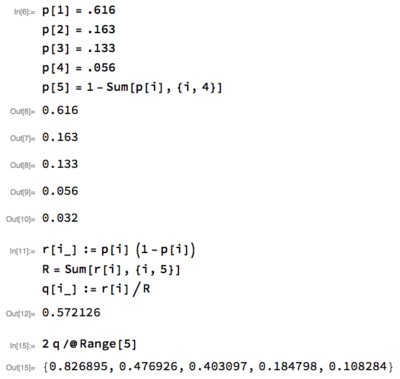
Exercise: 2015 census data is available by googling "us census quickfacts". While the categories don't precisely match those in this piece, you can use this data to get a rough estimate the fraction of interracial weddings that would involve a white spouse under random pairing. What do you get? Is your answer more or less than 82%?
Peter notes that he got just over 82%. Here is his solution (using Mathematica):

