Sandbox: Difference between revisions
| Line 38: | Line 38: | ||
Jack takes a coin from his pocket and decides that he will flip it 4 times in a row, writing down the outcome of each flip on a scrap of paper. After he is done flipping, he will look at the flips that immediately followed an outcome of heads, and compute the relative frequency of heads on those flips. Because the coin is fair, Jack of course expects this conditional relative frequency to be equal to the probability of flipping a heads: 0.5. Shockingly, Jack is wrong. If he were to sample 1 million fair coins and flip each coin 4 times, observing the conditional relative frequency for each coin, on average the relative frequency would be approximately 0.4. | Jack takes a coin from his pocket and decides that he will flip it 4 times in a row, writing down the outcome of each flip on a scrap of paper. After he is done flipping, he will look at the flips that immediately followed an outcome of heads, and compute the relative frequency of heads on those flips. Because the coin is fair, Jack of course expects this conditional relative frequency to be equal to the probability of flipping a heads: 0.5. Shockingly, Jack is wrong. If he were to sample 1 million fair coins and flip each coin 4 times, observing the conditional relative frequency for each coin, on average the relative frequency would be approximately 0.4. | ||
</blockquote> | </blockquote> | ||
To understand what this means, consider enumerating the 16 possible equally likely sequences of four tosses. | |||
In [http://andrewgelman.com/2015/07/09/hey-guess-what-there-really-is-a-hot-hand/#comments Hey—guess what? There really is a hot hand!] (9 July 2015), Andrew Gelman implements a simple R simulation that verifies this result (thanks to Jeff Witmer at Isostat for providing a link to this blog post). | In [http://andrewgelman.com/2015/07/09/hey-guess-what-there-really-is-a-hot-hand/#comments Hey—guess what? There really is a hot hand!] (9 July 2015), Andrew Gelman implements a simple R simulation that verifies this result (thanks to Jeff Witmer at Isostat for providing a link to this blog post). | ||
Revision as of 21:11, 23 July 2015
Bogus statistics
[How To Spot a Bogus Statistic]
by Geoffrey James, Inc.com, 30 May 2015
The article begins by citing Bill Gates recent recommendation that everyone should read the Darrell Huff classic How to Lie With Statistics.
As an object lesson, James considers efforts to dispute the scientific consensus on anthropogenic climate change.
Submitted by Bill Peterson
The GOP and bootstrapping
Ethan Brown posted this following link on the Isolated Statisticians list:
- [http://www.nytimes.com/interactive/2015/07/21/upshot/election-2015-the-first-gop-debate-and-the-role-of-chance.html The first G.O.P. debate:
Who’s in, who’s out and the role of chance]
- by Kevin Quealy and Amanda Cox , "Upshot" blog New York Times, 21 July 2015
Sleeping beauties
Doulas Rogers sent a link to the following:
- Defining and identifying Sleeping Beauties in science
- by Qing Ke, et. al., PNAS (vol. 112 no. 24), 2015.
The sleeping beauties of science
by Nathan Collins, Pacific Standard, 28 May 2015
Cites a 1901 paper by Karl Pearson
Maybe the "hot hand" exists after all
Kevin Tenenbaum sent a link to the following working paper :
- Surprised by the gambler’s and hot hand fallacies? A truth in the law of small numbers
- by Joshua Miller and Adam Sanjurjo, Social Science Research Network, 6 July 2015
In the abstract we read, "We find a subtle but substantial bias in a standard measure of the conditional dependence of present outcomes on streaks of past outcomes in sequential data. The mechanism is driven by a form of selection bias, which leads to an underestimate of the true conditional probability of a given outcome when conditioning on prior outcomes of the same kind." The authors give the following simple example to illustrate the bias
Jack takes a coin from his pocket and decides that he will flip it 4 times in a row, writing down the outcome of each flip on a scrap of paper. After he is done flipping, he will look at the flips that immediately followed an outcome of heads, and compute the relative frequency of heads on those flips. Because the coin is fair, Jack of course expects this conditional relative frequency to be equal to the probability of flipping a heads: 0.5. Shockingly, Jack is wrong. If he were to sample 1 million fair coins and flip each coin 4 times, observing the conditional relative frequency for each coin, on average the relative frequency would be approximately 0.4.
To understand what this means, consider enumerating the 16 possible equally likely sequences of four tosses.
In Hey—guess what? There really is a hot hand! (9 July 2015), Andrew Gelman implements a simple R simulation that verifies this result (thanks to Jeff Witmer at Isostat for providing a link to this blog post).
(See also The hot hand revisited in Chance News 101 for some earlier data analyses asserting evidence for the hot hand phenomenon.)
Some math doodles
<math>P \left({A_1 \cup A_2}\right) = P\left({A_1}\right) + P\left({A_2}\right) -P \left({A_1 \cap A_2}\right)</math>
Accidental insights
My collective understanding of Power Laws would fit beneath the shallow end of the long tail. Curiosity, however, easily fills the fat end. I long have been intrigued by the concept and the surprisingly common appearance of power laws in varied natural, social and organizational dynamics. But, am I just seeing a statistical novelty or is there meaning and utility in Power Law relationships? Here’s a case in point.
While carrying a pair of 10 lb. hand weights one, by chance, slipped from my grasp and fell onto a piece of ceramic tile I had left on the carpeted floor. The fractured tile was inconsequential, meant for the trash.

As I stared, slightly annoyed, at the mess, a favorite maxim of the Greek philosopher, Epictetus, came to mind: “On the occasion of every accident that befalls you, turn to yourself and ask what power you have to put it to use.” Could this array of large and small polygons form a Power Law? With curiosity piqued, I collected all the fragments and measured the area of each piece.
| Piece | Sq. Inches | % of Total |
|---|---|---|
| 1 | 43.25 | 31.9% |
| 2 | 35.25 | 26.0% |
| 3 | 23.25 | 17.2% |
| 4 | 14.10 | 10.4% |
| 5 | 7.10 | 5.2% |
| 6 | 4.70 | 3.5% |
| 7 | 3.60 | 2.7% |
| 8 | 3.03 | 2.2% |
| 9 | 0.66 | 0.5% |
| 10 | 0.61 | 0.5% |

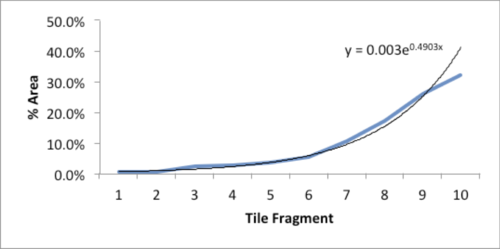
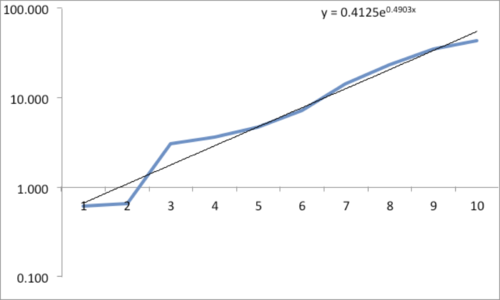
The data and plot look like a Power Law distribution. The first plot is an exponential fit of percent total area. The second plot is same data on a log normal format. Clue: Ok, data fits a straight line. I found myself again in the shallow end of the knowledge curve. Does the data reflect a Power Law or something else, and if it does what does it reflect? What insights can I gain from this accident? Favorite maxims of Epictetus and Pasteur echoed in my head: “On the occasion of every accident that befalls you, remember to turn to yourself and inquire what power you have to turn it to use” and “Chance favors only the prepared mind.”

My “prepared” mind searched for answers, leading me down varied learning paths. Tapping the power of networks, I dropped a note to Chance News editor Bill Peterson. His quick web search surfaced a story from Nature News on research by Hans Herrmann, et. al. Shattered eggs reveal secrets of explosions. As described there, researchers have found power-law relationships for the fragments produced by shattering a pane of glass or breaking a solid object, such as a stone. Seems there is a science underpinning how things break and explode; potentially useful in Forensic reconstructions. Bill also provided a link to a vignette from CRAN describing a maximum likelihood procedure for fitting a Power Law relationship. I am now learning my way through that.
Submitted by William Montante