

Robin Lock, Burry Professor of Statistics, St. Lawrence University
I have the luxury of teaching in a computer classroom with 28 workstations that are embedded in desks with glass tops to show the monitor below the work surface. This setup has several advantages (in addition to enforcing max class size cap of 28) since computing is readily available to use at any point in class, yet I can easily see all of the students, they can see me (no peeking around monitors), and they still have a nice big flat surface to spread out notes, handouts and, occasionally a text book (although many students now use an e-version of the text). I also have software on the instructor’s station (Smart Sync) that shows a thumbnail view of what’s on all student screens. Since the class is setup to use technology whenever needed and appropriate, it is natural to extend this to quizzes and exams, so my students routinely expect to use software as part of those activities.
[pullquote]Ideally I’d like to see what each student produces on the screen and how they interpret the output to make statistical conclusions, but it’s not practical to look over everyone’s shoulder as they work.[/pullquote]
This is useful when assessing simulation-based inference (SBI) methods since I can ask students to actually carry out the procedures, but this raises some challenges for constructing assessments that are doable in a relatively short amount of time (as opposed to projects that can go into greater depth), address the concepts I want to assess, and, don’t forget this one, still relatively efficient to grade! The last point can be a bit of a challenge, since SBI methods will generally not yield a single correct answer, yet with a little practice one can get pretty good at quickly distinguishing reasonable answers from responses that show errors in procedures or reasoning.
Using a Scaleless Distribution
Ideally I’d like to see what each student produces on the screen and how they interpret the output to make statistical conclusions, but it’s not practical to look over everyone’s shoulder as they work. I still do traditional paper/pencil quizzes and exams, so it’s also not feasible to have students electronically cut/paste graphics and other output. Having them draw a rough sketch is one option, but another workaround I’ve used is to include a “generic” distribution on the quiz with no scale shown and ask students to fill in the scale based on their simulated distribution. Here are a couple of examples from this semester’s quizzes that illustrate this approach. We use the StatKey software package (http://lock5stat.com/statkey) for generating bootstrap and randomization distributions.
Sample Question #1: Multiple Choices Some people say that, if you are randomly guessing on a multiple choice test, the correct answer is more likely to be a middle choice than at either extreme. For example, if the five choices are A, B, C, D and E, you should avoid picking A or E. Let’s try testing this theory.
(a) If the five multiple choice options are equally likely to be correct, what proportion of questions should have E as the correct choice?
(b) Suppose that a sample of n=400 multiple choice questions from AP exams had E as the correct choice for 68 questions. What is the proportion of questions with E correct in this sample? (Use good statistical notation to label your answer).
(c) Write down the hypotheses if the question of interest is whether there is evidence that the proportion of questions with E correct (call it pE ) is less than would be expected when answers are randomly assigned.
(d) Use StatKey to produce a randomization distribution for this test, based on the sample of 68 E answers out of 400 questions. On the plot below label the center of your randomization distribution and enough values on the horizontal axis to show the scale.
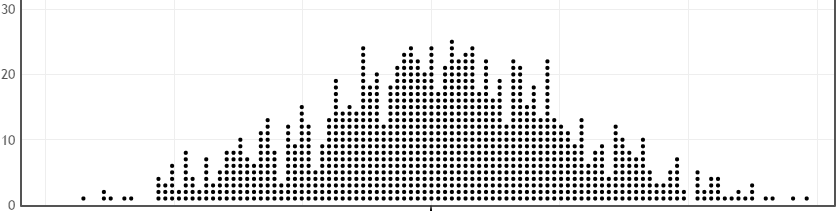
(e) What does a single dot in the plot above represent?
(f) Use StatKey to find the p-value for this test and show on the graph above how this looks.
(g) Assuming a 5% significance level, write a sentence that interprets what this test tells you in the context of this problem.
A quick glance at the scale shows if it is centered in the proper place (p0=0.2) or if students have forgotten to change the default p0=0.5 in StatKey or produced a bootstrap distribution that is centered at instead. We can also easily check if students are using the distribution properly to find the p-value using the proportion of samples with randomization .
Sample Question #2: Restaurant Tips We collected a random sample of n=157 restaurant bills from the First Crush bistro in Potsdam, NY and recorded the size of the tip on each bill. The data should be available in StatKey (if you are in the proper procedure – ask for a one-point penalty if you can’t find it).
(a) Use StatKey to construct a bootstrap distribution of mean tip size based on this sample. Your plot should look similar to the one below (Note: You could use the same plot as in the question above or generate a new one specifically for this dataset.). Label values on the horizontal axis to indicate the scale you see in your plot, including the center point.
(b) Find an 80% confidence interval for the mean tip size at First Crush, based on your bootstrap distribution. Indicate on your plot above how you find the interval and don’t forget the interpretive sentence.
Using StatKey’s built-in datasets is very convenient for exam purposes, but it is also very easy to enter new sample data, especially for inference involving proportions (as in Question #1) where students only need to enter the appropriate counts. For quantitative data, StatKey now allows users to upload their own file in .csv or .txt format, so it is relatively easy to give students access to a data file in an appropriate format to upload during the quiz. For readers who want the full RestaurantTips dataset the file can be downloaded from http:\\lock5stat.com.
Don’t have access to computers for quizzes and exams? Check the companion to this blog post by Kari Lock Morgan for tips on assessing SBI concepts without technology.