|
The applets in this section allow you see how probabilities and quantiles are determined from a Normal distribution.
The Normal distribution (sometimes referred to as the Gaussian distribution) is a continuous, symmetric distribution with varying uses in all aspects of statistics.
The Normal distribution is completely specified by two parameters: the mean ( ) and the variance ( ) and the variance ( 2).
The mean of a Normal distribution locates of the center of the density and can be any real number.
The variance of a Normal distribution measures the variability of the density and can be any positive real number.
The standard deviation ( 2).
The mean of a Normal distribution locates of the center of the density and can be any real number.
The variance of a Normal distribution measures the variability of the density and can be any positive real number.
The standard deviation ( ) is the square root of the variance and is used more for its interpretability.
The variance is used more for its nice mathematical features. ) is the square root of the variance and is used more for its interpretability.
The variance is used more for its nice mathematical features.
For a Normal random variable given by  the probability density function (p.d.f.) is the probability density function (p.d.f.) is
 | (1) |
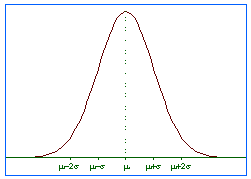
Figure 1 shows the probability density function (p.d.f.) for a Normal random variable with mean  and variance and variance  2. 2.

Figure 1. Normal p.d.f.
The cumulative distribution function (c.d.f.) of a Normal random variable is obtained by intergrating (1):
 | (2) |
Probabilities and quantiles are obtained from (2):
Because (1) is not integrable we use tables and computers to determine Normal probabilities and quantiles.
The Normal table, found in any standard statistics textbook, relies on the Standard Normal distribution (denoted by Z).
A Standard Normal distribution has mean 0 and variance 1.
Any Normal distribution can be transformed to a Standard Normal Distribution using the Z-transformation:
 | (3) |
Figure 2 shows how the Z-transformation preserves the probabilities.
The top curve is any Normal distribution; the bottom curve is the Standard Normal Distribution.
The shaded regions are equivalent in area.

Figure 2. Z-transformation.
The applets display two normal densities in two stacked plots similar in representation to Figure 2.
The density in the upper plot corresponds to a user-defined Normal random variable:

The density in the lower plot corresponds to a standard Normal random variable:

The shaded regions represent the probabilty being computed.
The regions for both plots are equivalent in area because of the Z-transformation defined by (3).
For the Normal Probabilities applets the probability is determined for chosen mean, variance, and limits.
For the Normal Quantiles applets the quantile is determined for chosen mean, variance, and a probability.
Due to limitations of screen size the applets restrict the variance to any number between 0.1 and 10, inclusively.
See also: Probability Distributions, T Distribution, Exponential Distribution, Central Limit Theorem, Confidence Intervals.
|