|
The applets in this section allow you to see how the Central Limit Theorem works.
The Central Limit Theorem states that as the sample size, n, approaches infinity the distribution of the sample mean approaches normality.

The beauty of the theorem is that the data being collected does not have to be normal.
In fact, the observations can be from any distribution whether it be symmetric, asymmetric, discrete, or continuous.
Five non-normal distributions are represented: Bernoulli, Poisson, Exponential, U-shaped, and Uniform.
Tables 1-3 give descriptions and details for each of the latter distributions.
|
|
The first applet computes 2000 sample means based on the provided sample size, n.
The second applet allows the user to choose among 200, 2000, or 20000 sample means.
Computing 20000 sample means for large n is not recommended except for fast computers.
A histogram of the sample means is overlaid with the theoretical normal curve for the given sample size.
See also: Confidence Intervals, Normal Distribution.
|
 Table 1. Descriptions of each distribution. Symmetry implies equal probability above and below the mean.

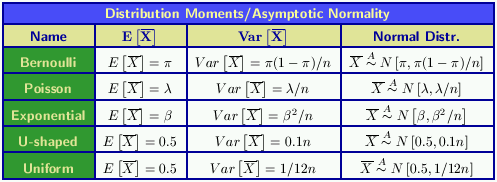 Table 3. Asymptotic normal distributions for sample means for each distribution. As n gets large, the distribution of the sample mean approaches normality with the above mean and variance.