Rectangularity: Part I. Sampling Distribution of the Sample Mean
Purpose:
This activity is intended to illustrate properties of the sampling distribution of a sample mean.
The Population of Rectangles Sheet shows a population of size
100 consisting of rectangles of varying areas. Each square counts as one
unit towards a rectangle’s area. The true average (mean) area of the
rectangles in the population is m=6.26. The true standard deviation of
the areas of the rectangles in the population is s=5.69. If we did not know m and wished to estimate it, we could draw a
simple random sample of rectangles from the population and use the mean area of
the sampled rectangles to estimate m.
The sample mean,![]() will vary from sample to
sample. The distribution of the
will vary from sample to
sample. The distribution of the![]() values for many simple
random samples of size n is called the sampling distribution of
the statistic
values for many simple
random samples of size n is called the sampling distribution of
the statistic ![]() .
.
Instructions:
Work in groups of three. Each group should have a random number table or a calculator capable of generating random numbers, a copy of the activity worksheet, and a copy of the questions sheet.
Label the rectangles in the population from 00 to 99. (Call Rectangle 1, 01; call Rectangle 2, 02; and so on up to Rectangle 99, which you should call 99. Call Rectangle 100, 00).
1. Select two different
simple random samples of size 5 from the population (sample with replacement --
so that it is possible to select the same rectangle more than once). For
each sample, list the labels of the rectangles selected, list the areas, and
then calculate the value of ![]() . Complete the tables
below. After you have completed the tables, write your two
values for
. Complete the tables
below. After you have completed the tables, write your two
values for ![]() on the whiteboard
under Sample Size n=5. Once the entire class has finished with random
samples of size n=5, complete the n=5 column on the data collection sheet.
(The data collection sheet is given at the end of Part I.)
on the whiteboard
under Sample Size n=5. Once the entire class has finished with random
samples of size n=5, complete the n=5 column on the data collection sheet.
(The data collection sheet is given at the end of Part I.)
Random Sample 1 Random Sample 2
|
Label |
Area |
|
Label |
Area |
|
|
|
|
|
|
|
|
|
|
|
|
|
|
|
|
|
|
|
|
|
|
|
|
|
|
|
|
|
|
![]() =
=
![]() =
=
2. Select two different
simple random samples of size 15 from the population (sample with
replacement). For each sample, list the labels of the rectangles selected,
list the areas, and then calculate the value of ![]() . Complete the
tables below. After you have completed the tables, write your two values
for
. Complete the
tables below. After you have completed the tables, write your two values
for ![]() on the whiteboard
under Sample Size n=15. Once the entire class has finished with random
samples of size n=15, complete the n=15 column on the data collection
sheet.
on the whiteboard
under Sample Size n=15. Once the entire class has finished with random
samples of size n=15, complete the n=15 column on the data collection
sheet.
Random Sample 1 Random Sample 2
|
Label |
Area |
|
Label |
Area |
|
|
|
|
|
|
|
|
|
|
|
|
|
|
|
|
|
|
|
|
|
|
|
|
|
|
|
|
|
|
|
|
|
|
|
|
|
|
|
|
|
|
|
|
|
|
|
|
|
|
|
|
|
|
|
|
|
|
|
|
|
|
|
|
|
|
|
|
|
|
|
|
|
|
|
|
|
|
|
|
|
|
|
|
|
|
|
|
|
|
![]() =
=
![]() =
=
3. Select two different
simple random samples of size 25 from the population (sample with
replacement). For each sample, list the labels of the rectangles selected,
list the areas, and then calculate the value of ![]() . Complete the
tables below. After you have completed the tables, write your two values
for
. Complete the
tables below. After you have completed the tables, write your two values
for ![]() on the whiteboard
under Sample Size n=25. Once the entire class has finished with random
samples of size n=25, complete the n=25 column on the data collection
sheet.
on the whiteboard
under Sample Size n=25. Once the entire class has finished with random
samples of size n=25, complete the n=25 column on the data collection
sheet.
Random Sample 1 Random Sample 2
|
Label |
Area |
|
Label |
Area |
|
|
|
|
|
|
|
|
|
|
|
|
|
|
|
|
|
|
|
|
|
|
|
|
|
|
|
|
|
|
|
|
|
|
|
|
|
|
|
|
|
|
|
|
|
|
|
|
|
|
|
|
|
|
|
|
|
|
|
|
|
|
|
|
|
|
|
|
|
|
|
|
|
|
|
|
|
|
|
|
|
|
|
|
|
|
|
|
|
|
|
|
|
|
|
|
|
|
|
|
|
|
|
|
|
|
|
|
|
|
|
|
|
|
|
|
|
|
|
|
|
|
|
|
|
|
|
|
|
|
|
|
|
|
|
|
|
|
|
|
|
|
|
|
|
|
|
|
|
|
![]() =
=
![]() =
=
Questions:
Answer the following questions using the data table on the data collection sheet.
1. For each sample size n = 5, 15, and 25 construct a histogram of the sample mean values.
2. For each sample size,
describe the shape of the distribution of ![]() values.
values.
3. Compare the shape of
the distributions of the ![]() values to the shape of the distribution of the
population. Which looks more normal?
values to the shape of the distribution of the
population. Which looks more normal?
4. Based on your histograms, what do you think is the relationship between the sample size and the shape of the distribution of the sample mean?
5. (a) For each sample size, calculate the standard deviation and the mean of the sample means.
(b) For which sample size is the standard deviation the largest and for which sample size is the standard deviation the smallest? Why do you suppose this happens?
6. How does the
standard deviation of the ![]() values compare to the
standard deviation of the population? What does this tell you about the
spread of the
values compare to the
standard deviation of the population? What does this tell you about the
spread of the ![]() values compared
to the spread of the population values?
values compared
to the spread of the population values?
7. Find an
expression for the mean of the sample means,![]() as a function of the mean
of the population, m.
as a function of the mean
of the population, m.
8. Try to develop a
formula to relate the standard deviation of the sample means,![]() to the population
standard deviation, s,
and the sample size, n. (Hint: the formula involves
to the population
standard deviation, s,
and the sample size, n. (Hint: the formula involves![]() )
)
Data Collection Sheet:
Data Table. Class Sample Means
|
Sample Number |
n = 5 |
n = 15 |
n = 25 |
|
1 |
|
|
|
|
2 |
|
|
|
|
3 |
|
|
|
|
4 |
|
|
|
|
5 |
|
|
|
|
6 |
|
|
|
|
7 |
|
|
|
|
8 |
|
|
|
|
9 |
|
|
|
|
10 |
|
|
|
|
11 |
|
|
|
|
12 |
|
|
|
|
13 |
|
|
|
|
14 |
|
|
|
|
15 |
|
|
|
|
16 |
|
|
|
|
17 |
|
|
|
|
18 |
|
|
|
|
19 |
|
|
|
|
20 |
|
|
|
Rectangularity: Part II. Confidence Interval for the Population Mean
Purpose:
This activity is intended to illustrate properties of confidence intervals and describe how to construct confidence intervals for a mean.
Statistical Guide: (Aliaga and Gunderson 1999)
A ![]() confidence interval for
m, the population mean, is given by:
confidence interval for
m, the population mean, is given by:
![]()
where ![]() is an appropriate
percentile of the t distribution having (n-1) degrees of freedom,
is an appropriate
percentile of the t distribution having (n-1) degrees of freedom,
![]() is the sample mean, s is the
sample standard deviation, and n is the sample size.
is the sample mean, s is the
sample standard deviation, and n is the sample size.
This interval gives a range of values within which we expect the population mean, m, to fall. The interval is based on just one sample mean and one sample standard deviation. The procedure assumes that the data are a random sample from a normal population with unknown standard deviation, s. If the sample size is large, the assumption of normality is not so crucial. However, outliers are always a concern.
The sample mean, ![]() , is a point (single number) estimate for the population
mean, m.
, is a point (single number) estimate for the population
mean, m.
A confidence interval estimate for the population mean, m, is an interval of values, computed from the sample data, that we believe contains m.
The confidence level is the probability that the estimation method will give an interval that contains the parameter (m, in this case). The confidence level is denoted by 1-a, where common values of a are 0.10, 0.05, and 0.01, corresponding to 90%, 95%, and 99% confidence.
Instructions:
The Population of Rectangles Sheet shows a population of size 100 consisting of rectangles of varying areas. Each square counts as one unit towards a rectangle’s area. The true average (mean) area of the rectangles in the population is m=6.26.
1. Select a simple random sample of 25 rectangles (sample with replacement -- so that it is possible to select the same rectangle more than once).
2. List your selected rectangle numbers and the corresponding areas in the table below.
|
Rectangle Number |
Area |
Rectangle Number |
Area |
|
|
|
|
|
|
|
|
|
|
|
|
|
|
|
|
|
|
|
|
|
|
|
|
|
|
|
|
|
|
|
|
|
|
|
|
|
|
|
|
|
|
|
|
|
|
|
|
|
|
|
|
|
|
|
|
|
|
|
|
|
|
|
| |
3. Calculate the mean and the standard deviation of the areas of your sampled rectangles:
Questions:
Remember that m=6.26.
1. Use your data to construct an 80% confidence interval for the mean area of the rectangles in the population. Write your confidence interval and your name on a sticky note and bring your note to the front of the room. The teacher will sketch your interval on the overhead transparency. On the overhead, you will see all of the confidence intervals constructed by the class.
(a) How many of the confidence intervals include the value of m=6.26? What percent is this?
(b) What percent of the confidence intervals did we expect to include the value of m=6.26?
(c) Explain how to interpret a level of confidence of 80%.
2. Use your data to construct a 99% confidence interval for the mean area of the rectangles in the population. Write your confidence interval and your name on a sticky note and bring your note to the front of the room. The teacher will sketch your interval on the overhead transparency. On the overhead, you will see all of the confidence intervals constructed by the class.
(a) How many of the confidence intervals include the value of m=6.26? What percent is this?
(b) What percent of the confidence intervals did we expect to include the value of m=6.26?
(c) Explain how to interpret a level of confidence of 99%.
(d) Explain how increasing the confidence level from 80% to 99% changed the confidence intervals.
(e) Give one advantage of using 99% confidence rather than 80% confidence. Give one disadvantage.
3. Explain why we used the sample mean of n=25 rectangle areas and not the sample mean of n=5 or n=15 rectangle areas to construct our confidence intervals.
Rectangularity: Part III. Hypothesis Test on the Population Mean
Purpose:
This activity is intended to illustrate properties of hypothesis testing and describe how to perform hypothesis tests on a mean.
Statistical Guide: (Aliaga and Gunderson 1999)
We want to test a hypothesis about a population mean, m. The null hypothesis is Ho:m=m0, where m0 is the hypothesized value for m. The data are assumed to be a random sample of size n from a population that has a normal distribution with unknown standard deviation, s. If the sample size is large, the assumption of normality is not so crucial. However, outliers are always a concern.
From the sample data, we calculate
the sample mean,![]() , and the sample standard deviation, s. We base our
decision about m on
the standardized sample mean,
, and the sample standard deviation, s. We base our
decision about m on
the standardized sample mean,

This is the test statistic, and under Ho it has a t-distribution with n-1 degrees of freedom.
We calculate the p-value (observed level of significance) for the test. The p-value depends on how the alternative hypothesis is expressed:
(1) If Ha:m>m0, then the p-value is the area to the right of the observed test statistic, under the Ho model.
(2) If Ha:m<m0, then the p-value is the area to the left of the observed test statistic, under the Ho model.
(3) If Ha:m¹m0, then the p-value is the sum of the area to the left of negative the absolute value of the observed test statistic and the area to the right of the absolute value of the observed test statistic, under the Ho model.
The p-value is the probability, computed under the assumption that Ho is true, of obtaining a test statistic value at least as favorable to Ha as the value that actually resulted from the data. If the p-value is small enough, Ho is rejected.
Rejecting the null hypothesis, when in fact it is true, is called a Type I error. The significance level, a, is the chance of committing a Type I error. If the p-value£a, Ho is rejected. If the p-value > a, Ho is not rejected.
Failing to reject the null hypothesis, when in fact it is not true, is called a Type II error. The chance of committing a Type II error is b. The chance of rejecting the null hypothesis, when in fact it is false, is called the Power of the test. The Power is 1-b.
Instructions:
The Population of Rectangles Sheet shows a population of size 100 consisting of rectangles of varying areas. Each square counts as one unit towards a rectangle’s area. The true average (mean) area of the rectangles in this population is m=6.26.
1. Select a simple random sample of 25 rectangles (sample with replacement -- so that it is possible to select the same rectangle more than once).
2. List your selected rectangle numbers and the corresponding areas in the table below.
|
Rectangle Number |
Area |
Rectangle Number |
Area |
|
|
|
|
|
|
|
|
|
|
|
|
|
|
|
|
|
|
|
|
|
|
|
|
|
|
|
|
|
|
|
|
|
|
|
|
|
|
|
|
|
|
|
|
|
|
|
|
|
|
|
|
|
|
|
|
|
|
|
|
|
|
|
| |
3. Calculate the mean and the standard deviation of the areas of your sampled rectangles:
Questions:
Throughout answering the following questions, remember that the true value of m = 6.26.
1. Test Ho:m=9 versus Ha:m<9.
Use p-values (observed significance levels) to perform the tests. Take calculations to two significant digits. Since Ho is false, a correct decision would be to reject Ho. An incorrect decision would be to fail to reject Ho. (This would be a Type II error.)
(a) Use a 5% level of significance (a=.05).
calculated test statistic =
p-value =
(Write your p-value on a sticky note and place it on the stem-and-leaf plot labeled Question 1.)
decision =
P(Type II error) = b For the class, b=
Power = 1-b. For the class, 1-b=
(b) Use a 20% level of significance (a=.20).
calculated test statistic =
p-value =
decision =
P(Type II error) =b. For the class, b=
Power = 1-b. For the class, 1-b=
(c) Explain how to interpret a Type II error rate in terms of repeatedly performing the procedure of selecting a sample and using the sample data to test a null hypothesis that should be rejected.
(d) Explain how the Type I error rate (a) is related to the Type II error rate (b). In addition, give an intuitive explanation as to why this relationship holds.
2. Test Ho:m=6.26 versus Ha:m¹6.26.
Use p-values (observed significance levels) to perform the tests. Take calculations to two significant digits. Since Ho is true, a correct decision would be to fail to reject Ho. An incorrect decision would be to reject Ho. (This would be a Type I error.)
(a) Use a 5% level of significance (a=.05).
calculated test statistic =
p-value =
(Write your p-value on a sticky note and place it on the stem-and-leaf plot labeled Question 2.)
decision =
expected number of rejections of Ho for the class =
number of rejections of Ho for the class =
(b) Use a 20% level of significance (a=.20).
calculated test statistic =
p-value =
decision =
expected number of rejections of Ho for the class =
number of rejections of Ho for the class =
(c) Explain how to interpret a Type I error rate in terms of repeatedly performing the procedure of selecting a sample and using the sample data to test a null hypothesis that should not be rejected.
3. Explain why we used the sample mean of n=25 rectangle areas and not the sample mean of n=5 or n=15 rectangle areas to perform our hypothesis tests.
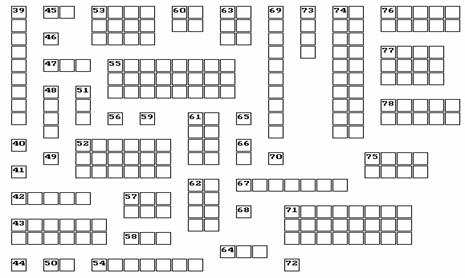
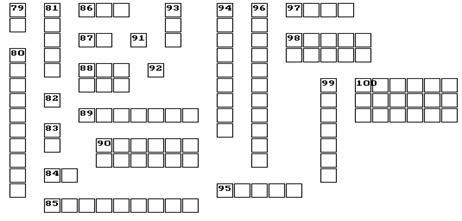
Parts I, II, and III. Population of Rectangles:
(The population of rectangles sheet is adapted from Scheaffer et al. 1996.)
|

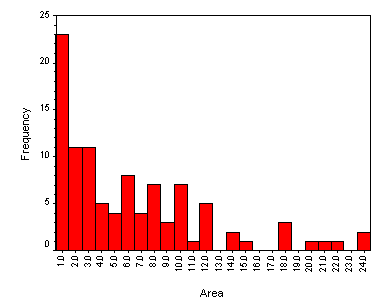
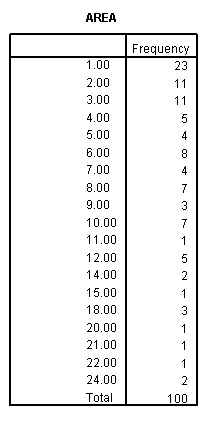
Parts I, II, and III. Histogram and Frequency Table of the Areas of the Rectangles in the Population:
Histogram of the Areas of the Rectangles in the Population:
Frequency Table of the Areas of the Rectangles in the Population:
Part II. Sheet for Overhead Transparency:
|
|
|
|
|
|
|
|
|
|
|
|
|
|
|
|
|
|
|
|
|
|
|
|
|
|
|
|
|
|
|
|
|
|
|
|
|
|
|
|
|
|
|
|
|
|
|
|
|
|
|
|
|
|
|
|
|
|
|
|
|
|
|
|
|
|
|
|
|
|
|
|
|
|
|
|
|
|
|
|
|
|
|
|
|
|
|
|
|
|
|
|
|
|
|
|
|
|
|
|
|
|
|
|
|
|
|
|
|
|
|
|
|
|
|
|
|
|
|
|
|
|
|
|
|
|
|
|
|
|
|
|
|
|
|
|
|
|
|
|
|
|
|
|
|
|
|
|
|
|
|
|
|
|
|
|
|
|
|
|
|
|
|
|
|
|
|
|
|
|
|
|
|
|
|
|
|
|
|
|
|
|
|
|
|
|
|
|
|
|
|
|
|
|
|
|
|
|
|
|
|
|
|
|
|
|
|
|
|
|
|
|
|
|
|
|
|
|
|
|
|
|
|
|
|
|
|
|
|
|
|
|
|
|
|
|
|
|
|
|
|
|
|
|
|
|
|
|
|
|
|
|
|
|
|
|
|
|
|
|
|
|
|
|
|
|
|
|
|
|
|
|
|
|
|
|
|
|
|
|
|
|
|
|
|
|
|
|
|
|
|
|
|
|
|
|
|
|
|
|
|
|
|
|
|
|
|
|
|
|
|
|
|
|
|
|
|
|
|
|
|
|
|
|
|
|
|
|
|
|
|
|
|
|
|
|
|
|
|
|
|
|
|
|
|
|
|
|
|
|
|
|
|
|
|
|
|
|
|
|
|
|
|
|
|
|
|
|
|
|
|
|
|
|
|
|
|
|
|
|
|
|
|
|
|
|
|
|
|
|
|
|
|
|
|
|
|
|
|
|
|
|
|
|
|
|
|
|
|
|
|
|
|
|
|
|
|
|
|
|
|
|
|
|
|
|
|
|
|
|
|
|
|
|
|
|
|
|
|
|
|
|
|
|
|
|
|
|
|
|
|
|
|
|
|
|
|
|
|
|
|
|
|
|
|
|
|
|
|
|
|
|
|
|
|
|
|
|
|
|
|
|
|
|
|
|
|
|
|
|
|
|
|
|
|
|
|
|
|
|
|
|
|
|
|
|
|
|
|
|
|
|
|
|
|
|
|
|
|
|
|
|
|
|
|
|
|
|
|
|
|
|
|
|
|
|
|
|
|
|
|
|
|
|
|
|
|
|
|
|
|
|
|
|
|
|
|
|
|
|
|
|
|
|
|
|
|
|
|
|
|
|
|
|
|
|
|
|
|
|
|
|
|
|
|
|
|
|
|
|
|
|
|
|
|
|
|
|
|
|
|
|
|
|
|
|
|
|
|
|
|
|
|
|
|
|
|
|
|
|
|
|
|
|
|
|
|
|
|
|
|
|
|
|
|
|
|
|
|
|
|
|
|
|
|
|
|
|
|
|
|
|
|
|
|
|
|
|
|
|
|
|
|
|
|
|
|
|
|
|
|
|
|
|
|
|
|
|
|
|
|
|
|
|
|
|
|
|
|
|
|
|
|
|
|
|
|
|
|
|
|
|
|
|
|
|
|
|
|
|
|
|
|
|
|
|
|
|
|
|
|
|
|
|
|
|
|
|
|
|
|
|
|
|
|
|
|
|
|
|
|
|
|
|
|
|
|
|
|
|
|
|
|
|
|
|
|
|
|
|
|
|
|
|
|
|
|
|
|
|
|
|
|
|
|
|
|
|
|
|
|
|
|
|
|
|
|
|
|
|
|
|
|
|
|
|
|
|
|
|
|
|
|
|
|
|
|
|
|
|
|
|
|
|
|
|
|
|
|
|
|
|
|
|
|
|
|
|
|
|
|
|
|
|
|
|
|
|
|
|
|
0 |
1 |
2 |
3 |
4 |
5 |
6 |
6.26
|
7 |
8 |
9 |
10 |
11 |
Part III. Stem-and-leaf Plot for Class p-values:
.0|
.0|
.1|
.1|
.2|
.2|
.3|
.3|
.4|
.4|
.5|
.5|
.6|
.6|
.7|
.7|
.8|
.8|
.9|
.9|
1 |
Answers to Activity Questions and Assessment Questions:
Part I.
Activity Questions.
3. The shape of the![]() values looks
more normal than the shape of the population (even for samples of size
5).
values looks
more normal than the shape of the population (even for samples of size
5).
4. As the sample size increases, the distribution of the sample mean becomes more normal.
5. (b) The standard
deviation of the![]() values is smallest for samples of size 25 and largest for samples
of size 5. Averages of 25 areas will be much less variable than averages
of only 5 areas.
values is smallest for samples of size 25 and largest for samples
of size 5. Averages of 25 areas will be much less variable than averages
of only 5 areas.
6. The standard deviation of
the![]() values is smaller than the standard deviation of the
population. Therefore, the spread of the
values is smaller than the standard deviation of the
population. Therefore, the spread of the![]() values is less than the
spread of the population values.
values is less than the
spread of the population values.
7. ![]() =m
=m
8. ![]()
Assessment Questions.
1. For a non-normal population, as the sample size
increases the shape of the sampling distribution of ![]() becomes approximately normal.
becomes approximately normal.
2. For samples of size 100, the shape of the sampling
distribution of![]() would be very
close to a normal distribution; the mean of the sampling distribution of
would be very
close to a normal distribution; the mean of the sampling distribution of ![]() ,
, ![]() would be equal to the
mean of the population, m=6.26; and the
standard deviation of the sampling distribution of
would be equal to the
mean of the population, m=6.26; and the
standard deviation of the sampling distribution of ![]() ,
, ![]() would be equal to
would be equal to
![]()
3. (a) We would expect the mean of the 365 daily sample means to be close to m = 12 mm.
(b) We would expect the standard deviation of the 365 daily
sample means to be close to ![]()
(c) We would expect the shape of the histogram of the 365 daily sample means to be very close to a normal distribution because the samples are of size n = 90.
(d) Using (a) to (c), we know ![]() Thus, we have
Thus, we have
![]() .
.
(e) The mean is not enough because the machine could produce parts that average out near 12 mm but individual parts may not be close to 12 mm. For example, two parts that are 1 mm and 23 mm average to 12 mm, but neither is useable.
Part II.
Activity Questions.
1. (b) 80%
(c) If we repeatedly select random samples from a population and construct a confidence interval for the mean of the population using each selected sample, 80% of the confidence intervals will successfully enclose the true mean of the population and 20% will not.
2. (b) 99%
(c) If we repeatedly select random samples from a population and construct a confidence interval for the mean of the population using each selected sample, 99% of the confidence intervals will successfully enclose the true mean of the population and 1% will not.
(d) The 99% confidence intervals are wider than the 80% confidence intervals.
(e) A 99% confidence interval is a highly reliable interval estimate but it may be imprecise. An 80% confidence interval is more precise but has relatively low reliability. The advantage of the 99% confidence interval is that it is very likely to enclose m. The disadvantage of the 99% confidence interval is that it may be too wide to give us a good estimate of the value of m. For example, a confidence interval of 1 to 24 will contain m (because the smallest rectangle has area 1 and the largest has area 24), but it does not provide us with a useable estimate of the true average.
3. The confidence interval
procedure assumes that the data are a random sample of size n from a
population that has a normal distribution. If the population distribution
is not normal, then we must select a sample that is large enough so that the distribution of ![]() is approximately normal. The population distribution of the rectangle areas is not
normal (it is skewed to the right), so we must use our largest sample (n=25) to
insure that the distribution of
is approximately normal. The population distribution of the rectangle areas is not
normal (it is skewed to the right), so we must use our largest sample (n=25) to
insure that the distribution of ![]() is
approximately normal.
is
approximately normal.
Assessment Questions.
1. (a) ![]() = 7.3
= 7.3
(b) ![]()
(c) ![]()
(d) 2.093
2. (a) Based on results from Part I, the standard
deviation of ![]() will tend to
get smaller when the sample size increases. (Or, in the previous problem
it was seen that the standard deviation formula will yield a smaller value when
n is larger.)
will tend to
get smaller when the sample size increases. (Or, in the previous problem
it was seen that the standard deviation formula will yield a smaller value when
n is larger.)
(b) Since the margin of error is a factor of the standard deviation, a smaller standard deviation will result in a smaller margin of error. (Thus, the margin of error based on the sample of size 40 will be smaller than the margin of error based on the sample of size 20.)
(c) Sample means based on the larger samples will tend to
have smaller standard deviations and hence tend to have smaller margins of error
when estimating m. That is, the
maximum possible distance that ![]() will be from
m (with some confidence level) will
tend to be smaller when larger samples are used; thus, resulting in more
precise estimates (i.e., narrower confidence intervals).
will be from
m (with some confidence level) will
tend to be smaller when larger samples are used; thus, resulting in more
precise estimates (i.e., narrower confidence intervals).
3. The confidence interval based on a sample of size 40 will be narrower than the one based on 25.
(This would follow from the previous problem.)
4. The 90% refers to the method used to construct the interval; 90% of the time this method will
yield an interval containing m. We cannot select one specific interval and state that it has a 90%
chance of containing m.
5. Since we cannot determine if either of these intervals contain m, we cannot determine if one of the
intervals is actually “better” than the other. We only know that if many more of these intervals
were constructed, about 95% of them will contain m.
Part III.
Activity Questions.
1. (c) If we repeatedly perform the procedure of selecting a sample and using the sample data to test a hypothesis about a population parameter, the Type II error rate is the percentage of the samples that would lead us to fail to reject a false null hypothesis.
(d) The Type I error rate is inversely related to the Type II error rate. If, for instance, we decrease the Type I error rate, we are making it more difficult to reject the null hypothesis, which in turn will increase the chances of failing to reject a false null hypothesis; therefore, increasing the Type II error rate.
2. (c) If we repeatedly perform the procedure of selecting a sample and using the sample data to test a hypothesis about a population parameter, the Type I error rate is the percentage of the samples that would lead us to reject a true null hypothesis.
3. The hypothesis testing
procedure assumes that the data are a random sample of size n from a
population that has a normal distribution. If the population distribution
is not normal, then we must select a sample that is large enough so that the distribution of ![]() is approximately normal. The population distribution of the rectangle areas is not
normal (it is skewed to the right), so we must use our largest sample (n=25) to
insure that the distribution of
is approximately normal. The population distribution of the rectangle areas is not
normal (it is skewed to the right), so we must use our largest sample (n=25) to
insure that the distribution of ![]() is
approximately normal.
is
approximately normal.
Assessment Questions.
1. (a)Ho:m=200 Ha:m<200
(b) A Type I error in the context of this problem would be if we decide the mean number of defective Widgets will be less than 200 with the new machine when in fact it won’t. That is, we decide to buy a new machine and it is no better than the old machine.
(c) A Type II error in the context of this problem would be if we do not decide the mean number of defective Widgets will be less than 200 but it really would have decreased. That is, we decide not to buy a new machine and the new machine would do better.
(d) If a Type I error occurred, the company would pay $1 million for a machine that doesn’t improve the defective rate.
(e) For this situation, the 1% significance level (a=.01) would be best since a Type I error is the more serious error - recall that a is the probability of a Type I error.
2. Type I error and Type II error are inversely related. Thus, if you reduce the Type I error rate, you will increase the Type II error rate.
3. (a) Ho:m=10 Ha:m>10

p-value = ![]() = .035
Fail to Reject Ho, since .035 > .01.
= .035
Fail to Reject Ho, since .035 > .01.
(b) Ho:m=10 Ha:m>10

p-value = ![]() =
.005
Reject Ho, since .005 < .01.
=
.005
Reject Ho, since .005 < .01.
(c) When you use a larger sample size, you decrease the
standard error (![]() ) because you have more information about the value of m. This makes it easier to reject the
null hypothesis.
) because you have more information about the value of m. This makes it easier to reject the
null hypothesis.
(d) When the sample size
increases, the standard error (![]() ) decreases, which
results in the absolute value of the test statistic increasing.
) decreases, which
results in the absolute value of the test statistic increasing.
(e) When the sample size increases, the absolute value of the test statistic increases, which results in the p-value decreasing.
(f) As the sample size increases, the probability of a Type II error decreases, and the Power of the test will increase.