> |
Which
paper towel is more absorbent?
John E. Boyer*, Deborah J. Rumsey**,
Christopher R. Bilder***,
and Christopher J.
Malone*
*
Department of Statistics
Kansas State
University
Manhattan, KS 66506
** Department of
Mathematics
Ohio State University
Columbus, OH
43210
***Department of Statistics
Oklahoma State University
Stillwater, OK
74078
Statistics Teaching and
Resource Library, February 7, 2001
© 2001 by John E. Boyer, Deborah J. Rumsey, Christopher R. Bilder, and Christopher J.
Malone, all rights reserved. This text may be freely shared among
individuals, but it may not be republished in any medium without
express written consent from the authors and advance notification
of the editor.
This
group activity focuses on conducting an experiment to determine
which of two brands of paper towels are more absorbent by
measuring the amount of water absorbed. A two-sample t-test can be
used to analyze the data, or simple graphics and descriptive
statistics can be used as an exploratory analysis. Students are
asked to think about design issues, and to write a short report
stating their results and conclusions, along with an evaluation of
the experimental design.
Key
words: Two-sample t-test
MATERIALS
Each
group (2-4 students) needs the following: glass, ruler, stop
watch, tongs, water supply, several sheets of each of two brands
of paper towels
TIME
One
48-minute class period
OBJECTIVE
Conduct an experiment to compare the absorbency
properties of two brands of paper towels by measuring the amount
of water each can
absorb.
DIRECTIONS
Appoint, with the agreement of the team members,
one person who will always fold and dip the paper towel in the
glass, and a second person who will read all the water
measurements. One person in the group (it may be one of those
listed above) will need to record the data for the group. Any
other group members assist in the experiment and take
notes.
Start
by deciding how many measurements you will make on each brand. (A
minimum of 4 is required.) After deciding, establish a
randomization scheme which provides the order in which
observations will be taken.
|
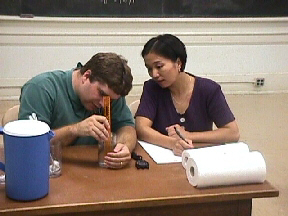
When you are ready to start have the person
assigned to the measuring duties put an amount of water into
the glass, measuring it carefully with the ruler. (About
10cm in a common 12oz. glass works pretty well.)
|
 |
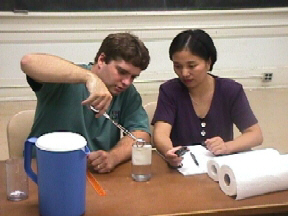 |
Have the person appointed to dip the paper
towel describe the method by which they will insert the
towel into the glass (are they going to fold it carefully
first, or will they wad it up, or will they just kind of
cram it in?). |
|
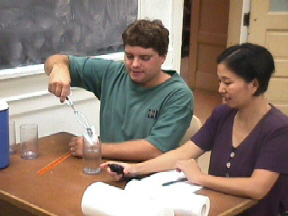
Also have that person describe when they will
remove the towel from the water (how long will they leave it
in, will they toss it out as wet as possible, will they let
it drain a little, will they let it drain until it stops
dripping?) |
 |
Now
proceed with the first observation. As soon as the towel has been
discarded, have the measuring person measure the amount of water
left, and record the difference between this value and the initial
amount of water as the amount absorbed by the towel.
Repeat
this process, duplicating the conditions at each trial as nearly
as possible. Record the data in two columns, one for each brand.
Beside each observation record the observation number (1 for
first, 2 for second, etc.). You may look back at these numbers
later to see if there was any trend across time in the way you
took measurements.
Discuss with the group appropriate techniques for
looking for differences in the absorbencies. Which graphical
displays will help you explore the data? Which hypothesis test can
be conducted? Does there appear to be a difference between the two
brands of paper towel? Conduct the hypothesis test, draw a
graphical display of your data, and draw conclusions.
Discuss with your group any problems that came about in
conducting this experiment. If you had the opportunity to redesign
this experiment, what changes would you have made, and why? Items
to think about: who carried out the experiment (same person each
time?); how the experiment was conducted (same way each time?);
how the measurements were made (was this accurate and
consistent?); was randomization used?; are the paper towels you
used in the experiment a representative sample of the whole
population of paper towels from each of these two brands? What
problems arose that you can prevent next
time?
ASSESSMENT
Each
person in the group turn in a short typed report (2-3 pages)
outlining the design of your experiment, the data you collected,
the analyses, graphical display of the data, conclusions, and a
brief assessment of how the experiment was designed and conducted.
Provide the appropriate computations and graphics, and
write a couple of sentences in the way of conclusions. (Remember,
your ultimate goal here is to decide whether or not there are
absorbency differences. Your conclusions should reflect that.)
Briefly discuss any changes you would make in your design, if you
had the chance to do the experiment again. Although the members of
your group will all have the same general results, please write up
this report in your own words.
Your report will be graded
using the following scheme:
25%
appropriate design; answering issues 1-8
above
25%
conducting the experiment; recording
results
25%
analysis of results; providing
statistics
20%
clear explanations, appropriate
conclusions
5%
professional look (typed, professional-looking data
display, spell-grammar checked)
|
TEACHER NOTES
Devise a method to organize groups quickly, and
have materials ready. Organize groups of appropriate size so
everyone has a job to do. As the activity takes place, be prepared
for questions regarding what to do if a paper towel tears, etc.
Encourage them to solve their own problems. Emphasize that
problems in data collection come up often, and to come up with
solutions that are reasonable in terms of the design issues. Be
sure to identify which brand was which after the activity is over-
they will ask!
Editor's
note: Before 11-6-01, the "student's version" of an
activity was called the "prototype".
|
|