In this advanced version of the “Keep your eyes on the ball” activity by Bereska, et al. (1999), each group is to explore the relationship between the ball’s rebound height and the height from which it is initially dropped, to use linear regression to describe this relationship, and to draw inferences using the fitted line. Here rebound height is defined to be the highest level of ascent that the ball makes after impact with the floor or ground.
First, your group should select a ball for study. The ball should be dropped from each of ten heights five times. Your group should determine ten appropriate drop heights that you will use for this experiment. Your group should also appoint one student to drop the ball, a second to observe the rebound height, and a third to record the data. Additional observers are helpful on spotting the rebound height. A data sheet (attached) should be used to record your data.
Some practice drops should be taken. Both the drop height and the rebound height should be recorded for the bottom, not the top, of the ball. Why?
A measuring stick can be used to position the ball at the appropriate drop height and then again to mark the height of rebound as illustrated in the diagram below (DIAGRAM 1). Another approach is to use chalk or post-it notes to create tick marks on the wall or building side corresponding to each level of the independent variable. It will quickly become obvious that the most challenging part of this activity is to accurately record the rebound height. The rebound-height observer must be at about eye level with the rebound height to record it accurately. It is difficult, if not impossible, to observe very small rebound heights so the group will need to be sure that the minimum drop height is not too low. It is also difficult to read the rebound height at the time of the drop. Bereska, et al. (1999) suggest using a piece of paper or cardboard to track the ball’s bounce. It is easier to record the rebound heights for higher drop heights so you may want to start with these.
 |
DIAGRAM 1: Making use of a measuring stick to place the ball for dropping as well as to record its rebound height.
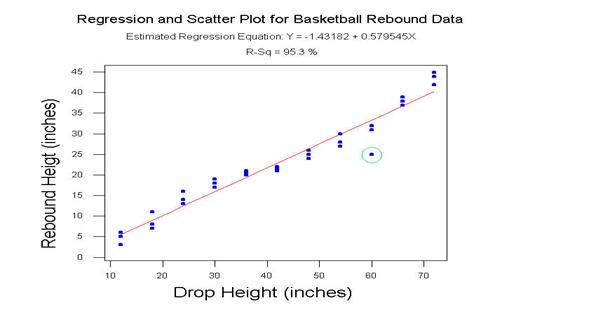
After completing data collection, plot the data. The independent variable should be on the x-axis, and the dependent one on the y-axis. Note that because the drop height was determined by the group and could have been set to many different values, it is an independent variable. However, the rebound height depends on the initial drop height and is thus the dependent variable. Notice that all rebound heights are not the same for a given drop height. Why?
Do you see a pattern to the data? If so, describe it.
An assumption for linear regressions is that there is a population of y-values (rebound heights) at each x-value (drop height) and that the means of the populations lie on a line. Use a different color or symbol on the graph to denote the sample mean of the rebound heights for each drop height. Does it appear that these lie on a line?
Remember, only five rebound heights are recorded for each drop height so the average of these five values is an estimate of the mean rebound height for that drop height. Therefore, these sample means will not all lie exactly on the line even if the population relationship between drop height and mean rebound height is linear.
Assuming that a line will adequately describe the relationship in the means of the rebound heights and the drop heights, interpret the intercept and slope. What do you think the intercept should be? Looking at the plot, what is the intercept likely to be? If the two are not about the same, why aren’t they?
What would a slope less than, equal to, or greater than one mean about the behavior of the ball when it is dropped? Do you expect the slope to be less than, equal to, or greater than one? Looking at the graph, do the data seem to agree with your expectations?
Another assumption for linear regression is that the variability of the population of y-values (rebound heights) is the same for each x-value (drop height). Does this seem to be a reasonable assumption for these data? Plot the sample standard deviations versus drop heights for these data. Does your plot confirm your assumption?
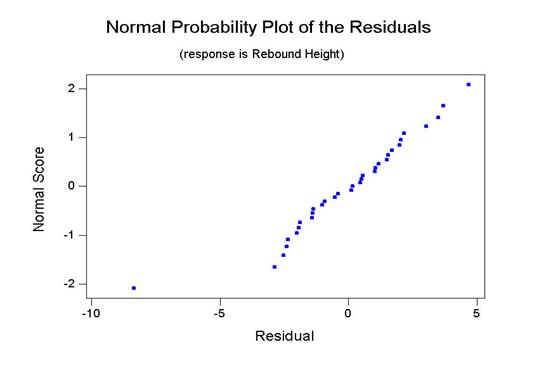
If confidence intervals are to be set on the parameters or hypotheses tests are to be conducted, an additional assumption is that each population of y-values (rebound heights) is normally distributed for a given drop height. A good test of this assumption requires more than five observations. However, extreme departures from normality can sometimes be seen with only five values. Do you see any evidence that causes you to doubt this assumption?
Now, estimate the population regression line. What is the estimated slope? What is its interpretation in the context of this experiment? Is the slope significantly less than one? What does this imply about the behavior of the ball after it is dropped?
What is the estimated intercept, and what does it mean for these data? Is the intercept significantly different from zero? Since the rebound height must be zero if the drop height is zero, what would an intercept significantly different from zero imply?
Set a 95% confidence interval for the mean rebound height for a ball dropped from a height for which you did not collect data. Interpret this interval in the context of this activity.
Predict the rebound height for a ball dropped from a height for which you set the confidence interval. Set a 95% prediction interval on this height. Interpret this interval in the context of this activity. Now, drop the ball from the height for which the prediction was made. Did it fall within the interval? How are the two intervals different? Why?
What is the population to which you can use the regression line to draw inferences? For example, could you draw inferences using the line you estimated for another type of ball or for another ball of the same type? What if the location of data collection changed? Did the same person always drop the ball or always observe the rebound height? If group members changed roles during the course of this experiment do you think that the regression assumptions are still valid? If not, which assumptions do you think are violated as a result of switching roles?